
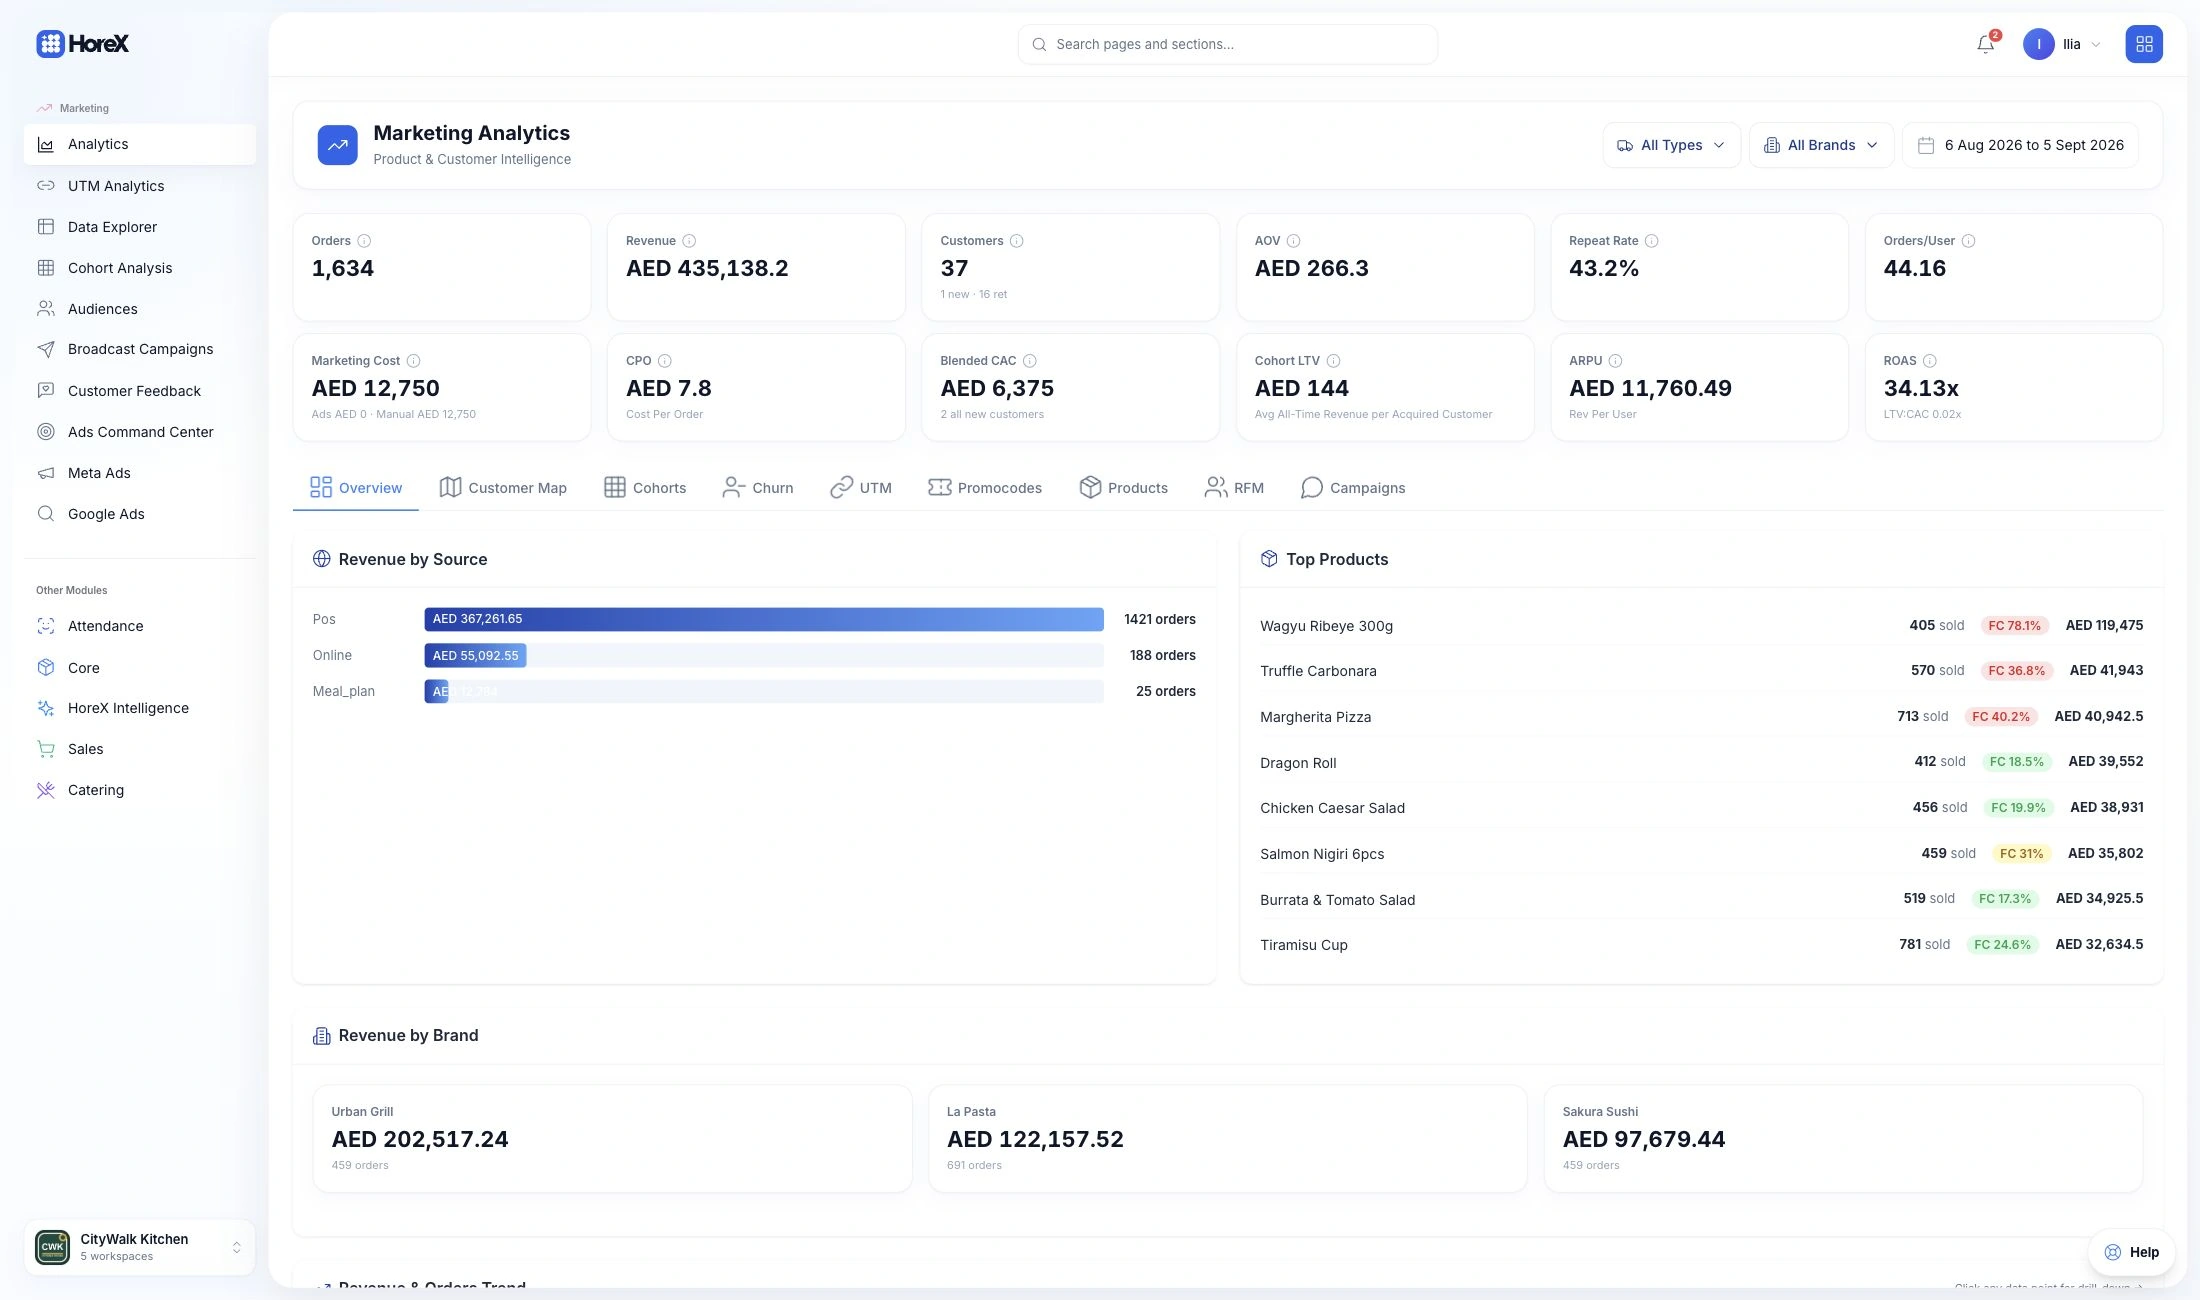





Marketing analytics and advertising for restaurants.

Connect Meta and Google Ads, campaign links, restaurant orders and guest history. Find where demand comes from, what it costs to win an order and which guests come back — then use that insight in your next campaign.

01 / ORDERS & REVENUE

End-to-end attribution

Connect campaign sources and ad costs to restaurant orders and revenue.

02 / ADVERTISING

Meta & Google Ads

Compare campaigns, inspect creatives and manage advertising budgets.

03 / LOCAL DEMAND

Geo marketing

Understand delivery demand and advertise around your restaurant.

04 / CUSTOMER GROWTH

Retention & guest value

Follow repeat orders, spending and the guests who stop returning.

05 / TAKE ACTION

Audiences & campaigns

Turn order history into specific groups and relevant follow-ups.

06 / DEEPER ANALYSIS

Reports for your team

Compare brands, explore the orders and build your own report views.

Explore all features

01 / END-TO-END ATTRIBUTION

See the restaurant revenue behind your marketing.

A guest follows a campaign link and orders from your restaurant. HoreX keeps the available source tags with the order, connects it to the guest and brings the revenue into your marketing reports.

Compare that revenue with connected Meta and Google ad spend. Continue into the customer’s purchase history to understand whether the first order became a repeat relationship, including identified visits at the POS.

  • Campaign → order → guest history
  • Advertising cost beside order revenue
  • Connected website, app and POS activity
  • New customers and repeat purchases
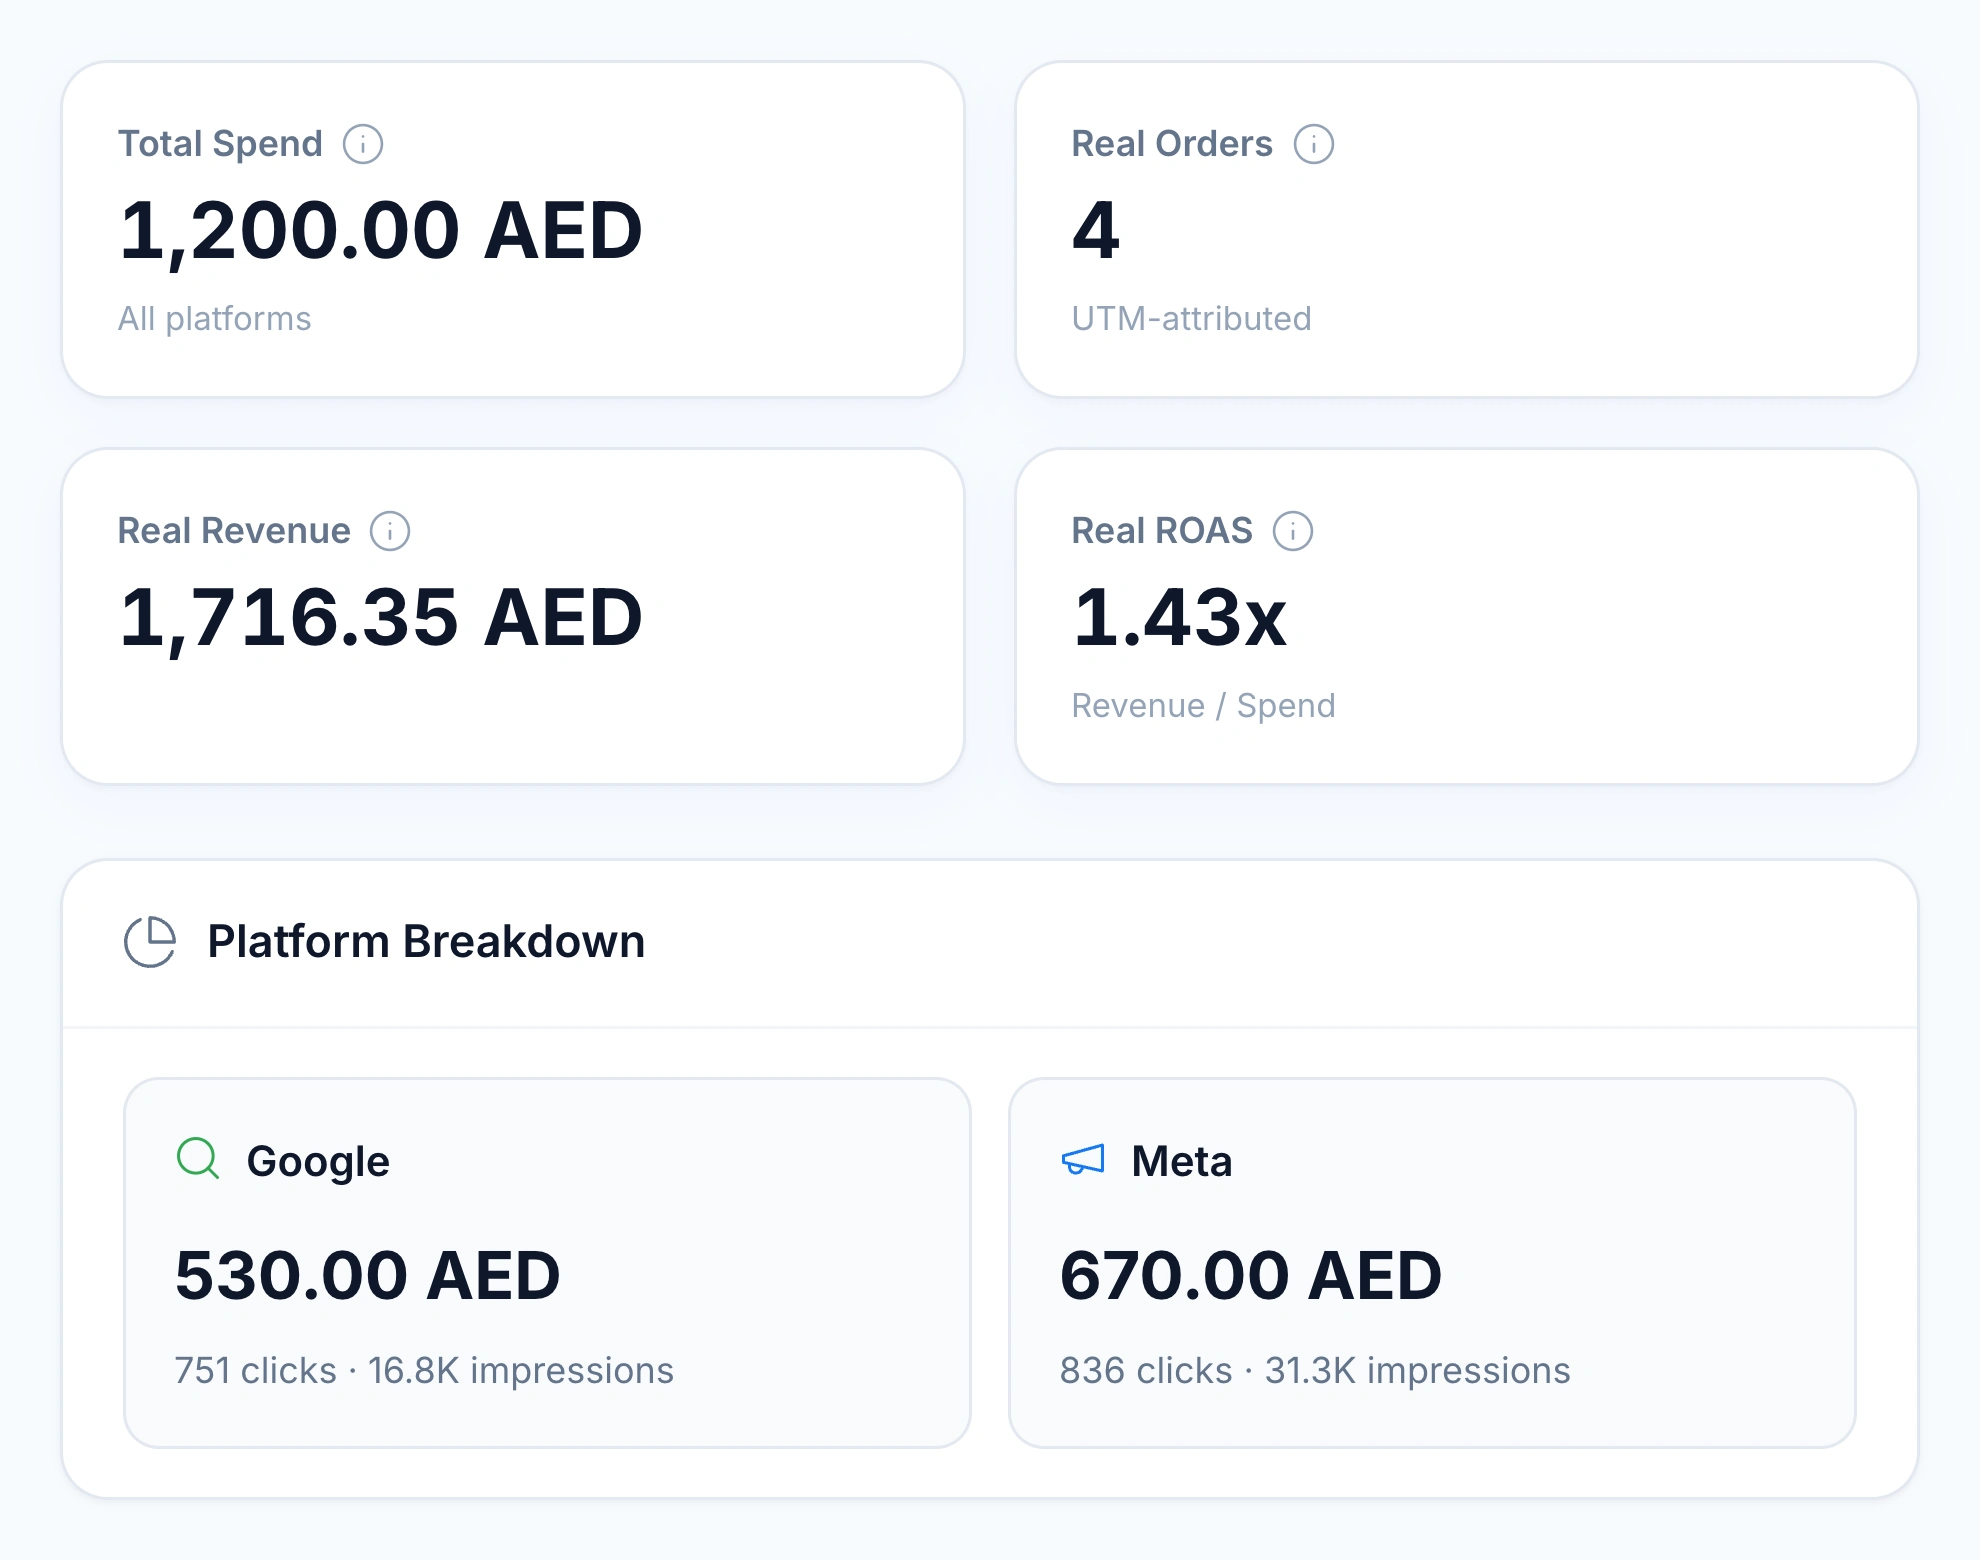
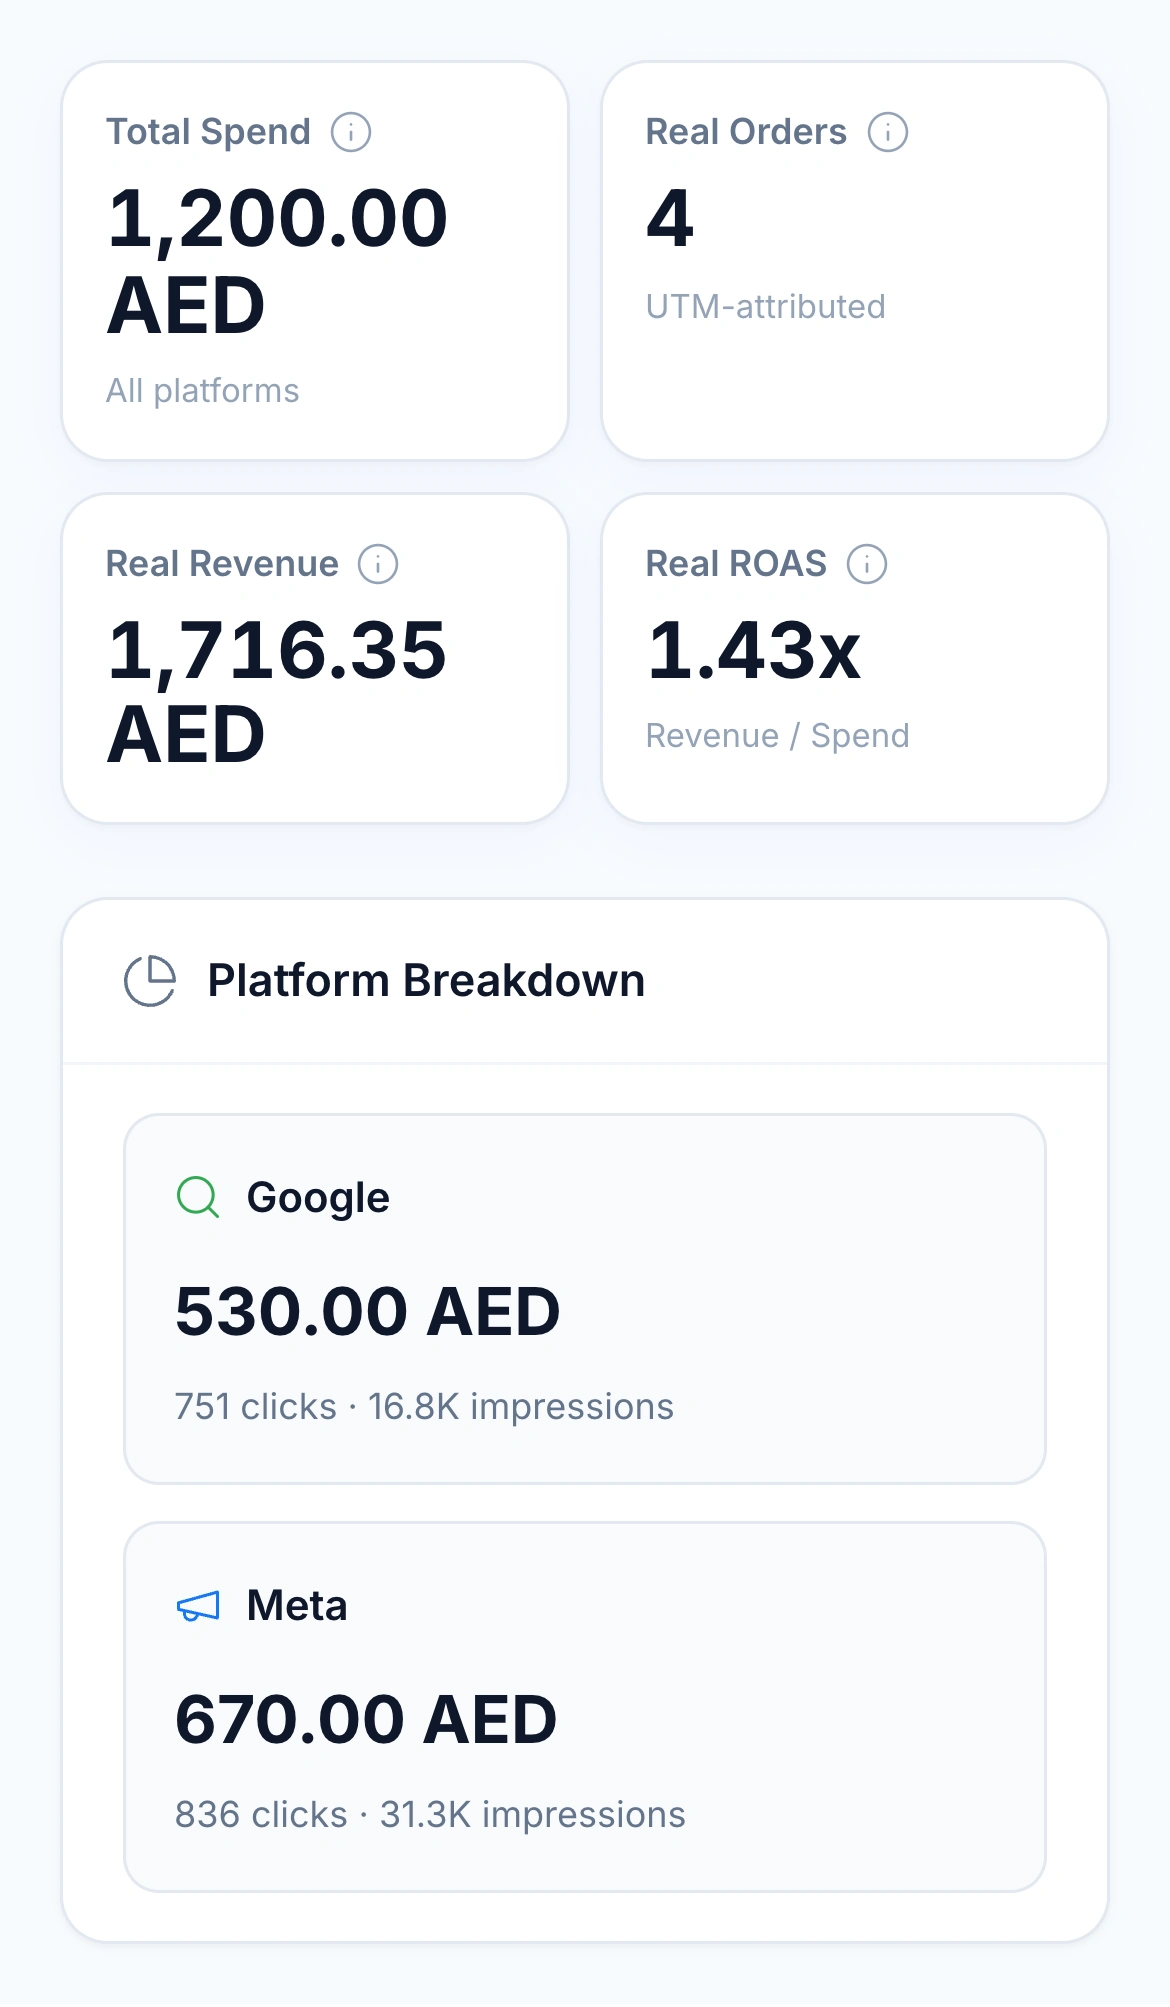
HoreX Ads Command Center: spend, UTM-attributed orders, revenue, real ROAS and Meta/Google breakdown
Example account · April 2026
HoreX Ads Command Center: spend, UTM-attributed orders, revenue, real ROAS and Meta/Google breakdown
Example account · April 2026

02 / META & GOOGLE ADS

Manage advertising with restaurant results in view.

Bring Meta and Google campaigns into Ads Command Center. Compare spend, clicks, cost per click and the orders matched to each campaign. Platform-reported ROAS and HoreX order-based ROAS sit alongside each other, so you can see what each source reports.

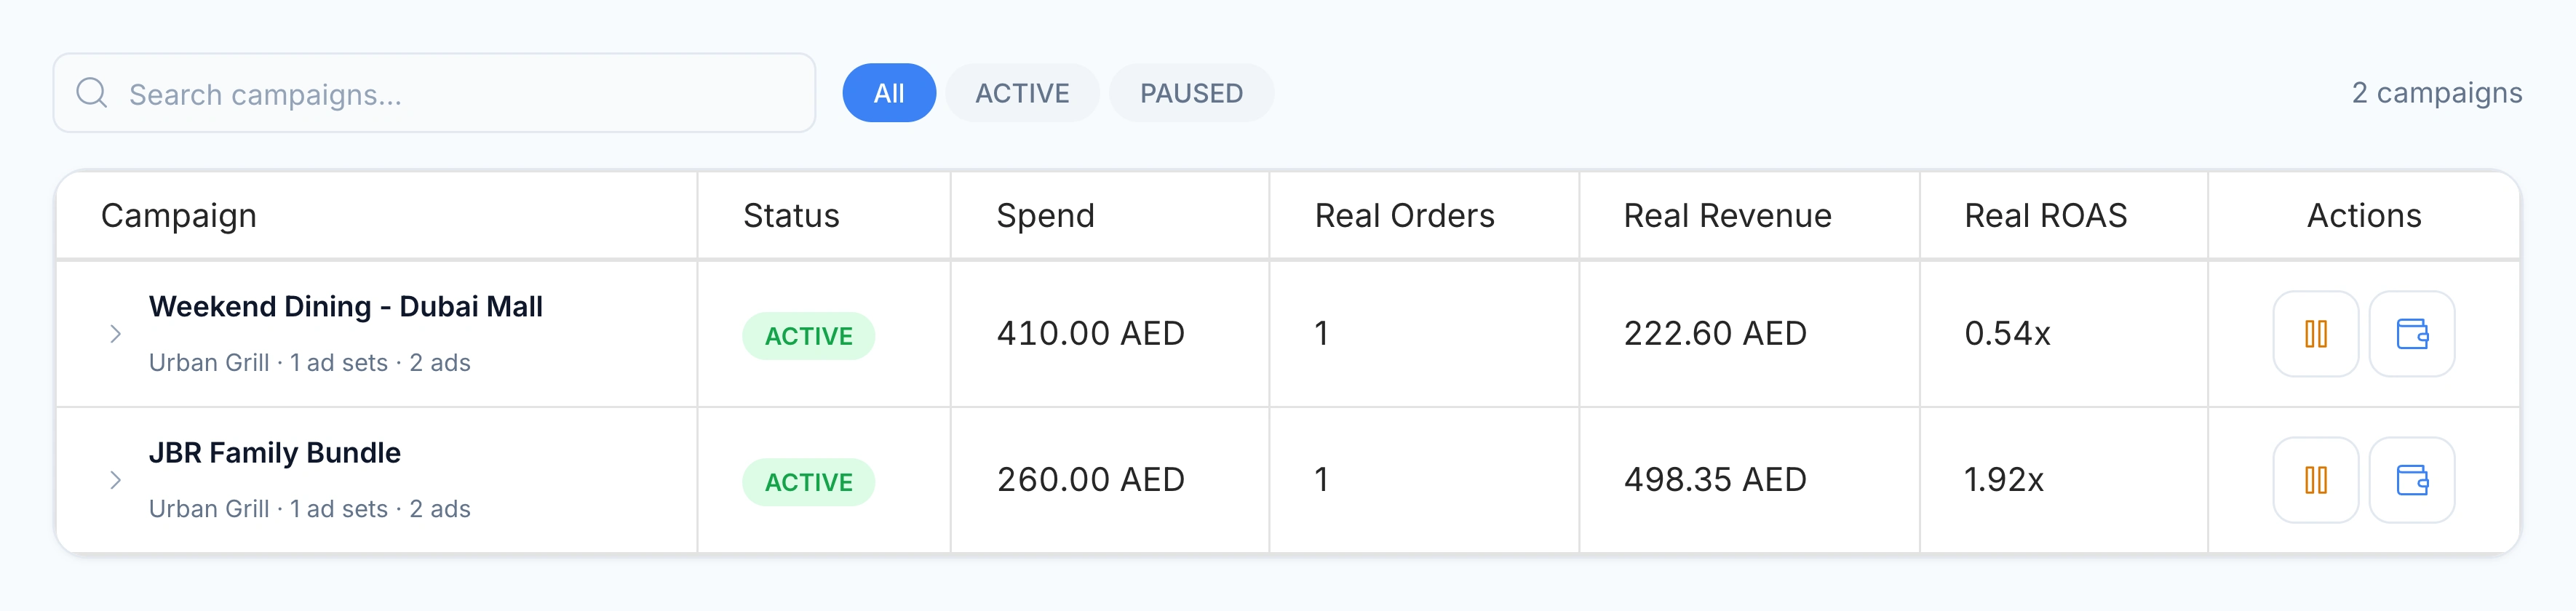
Meta Ads campaigns with spend, attributed orders, revenue, real ROAS and budget/pause actions
Example campaigns · April 2026
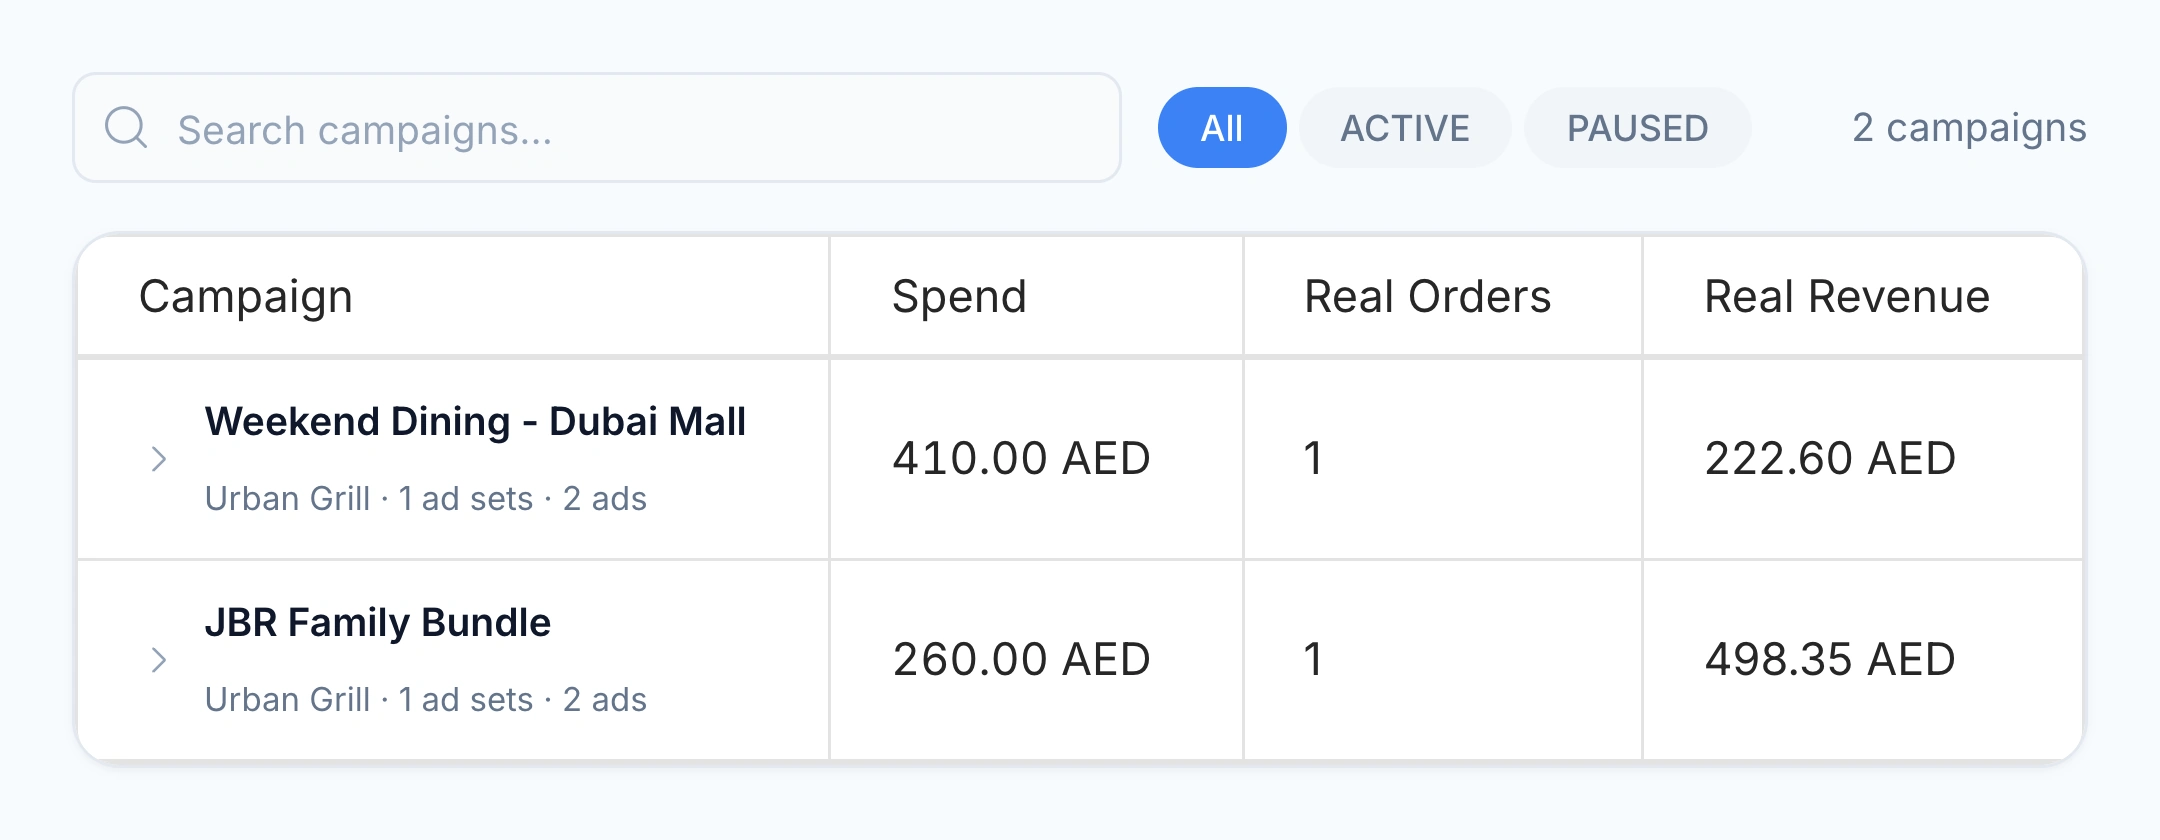
Meta Ads campaigns with spend, attributed orders and revenue
Example campaigns · April 2026

Open a campaign to inspect its ad sets and creatives. Adjust the budget or pause a campaign from the same workspace. Review a promotion for one branch against another before deciding where the next advertising budget should go.

  • Meta campaigns, ad sets and creatives
  • Google campaign performance
  • Campaign budgets and pause controls
  • Order revenue and acquisition metrics

03 / GEO MARKETING

Understand your area. Reach the guests around it.

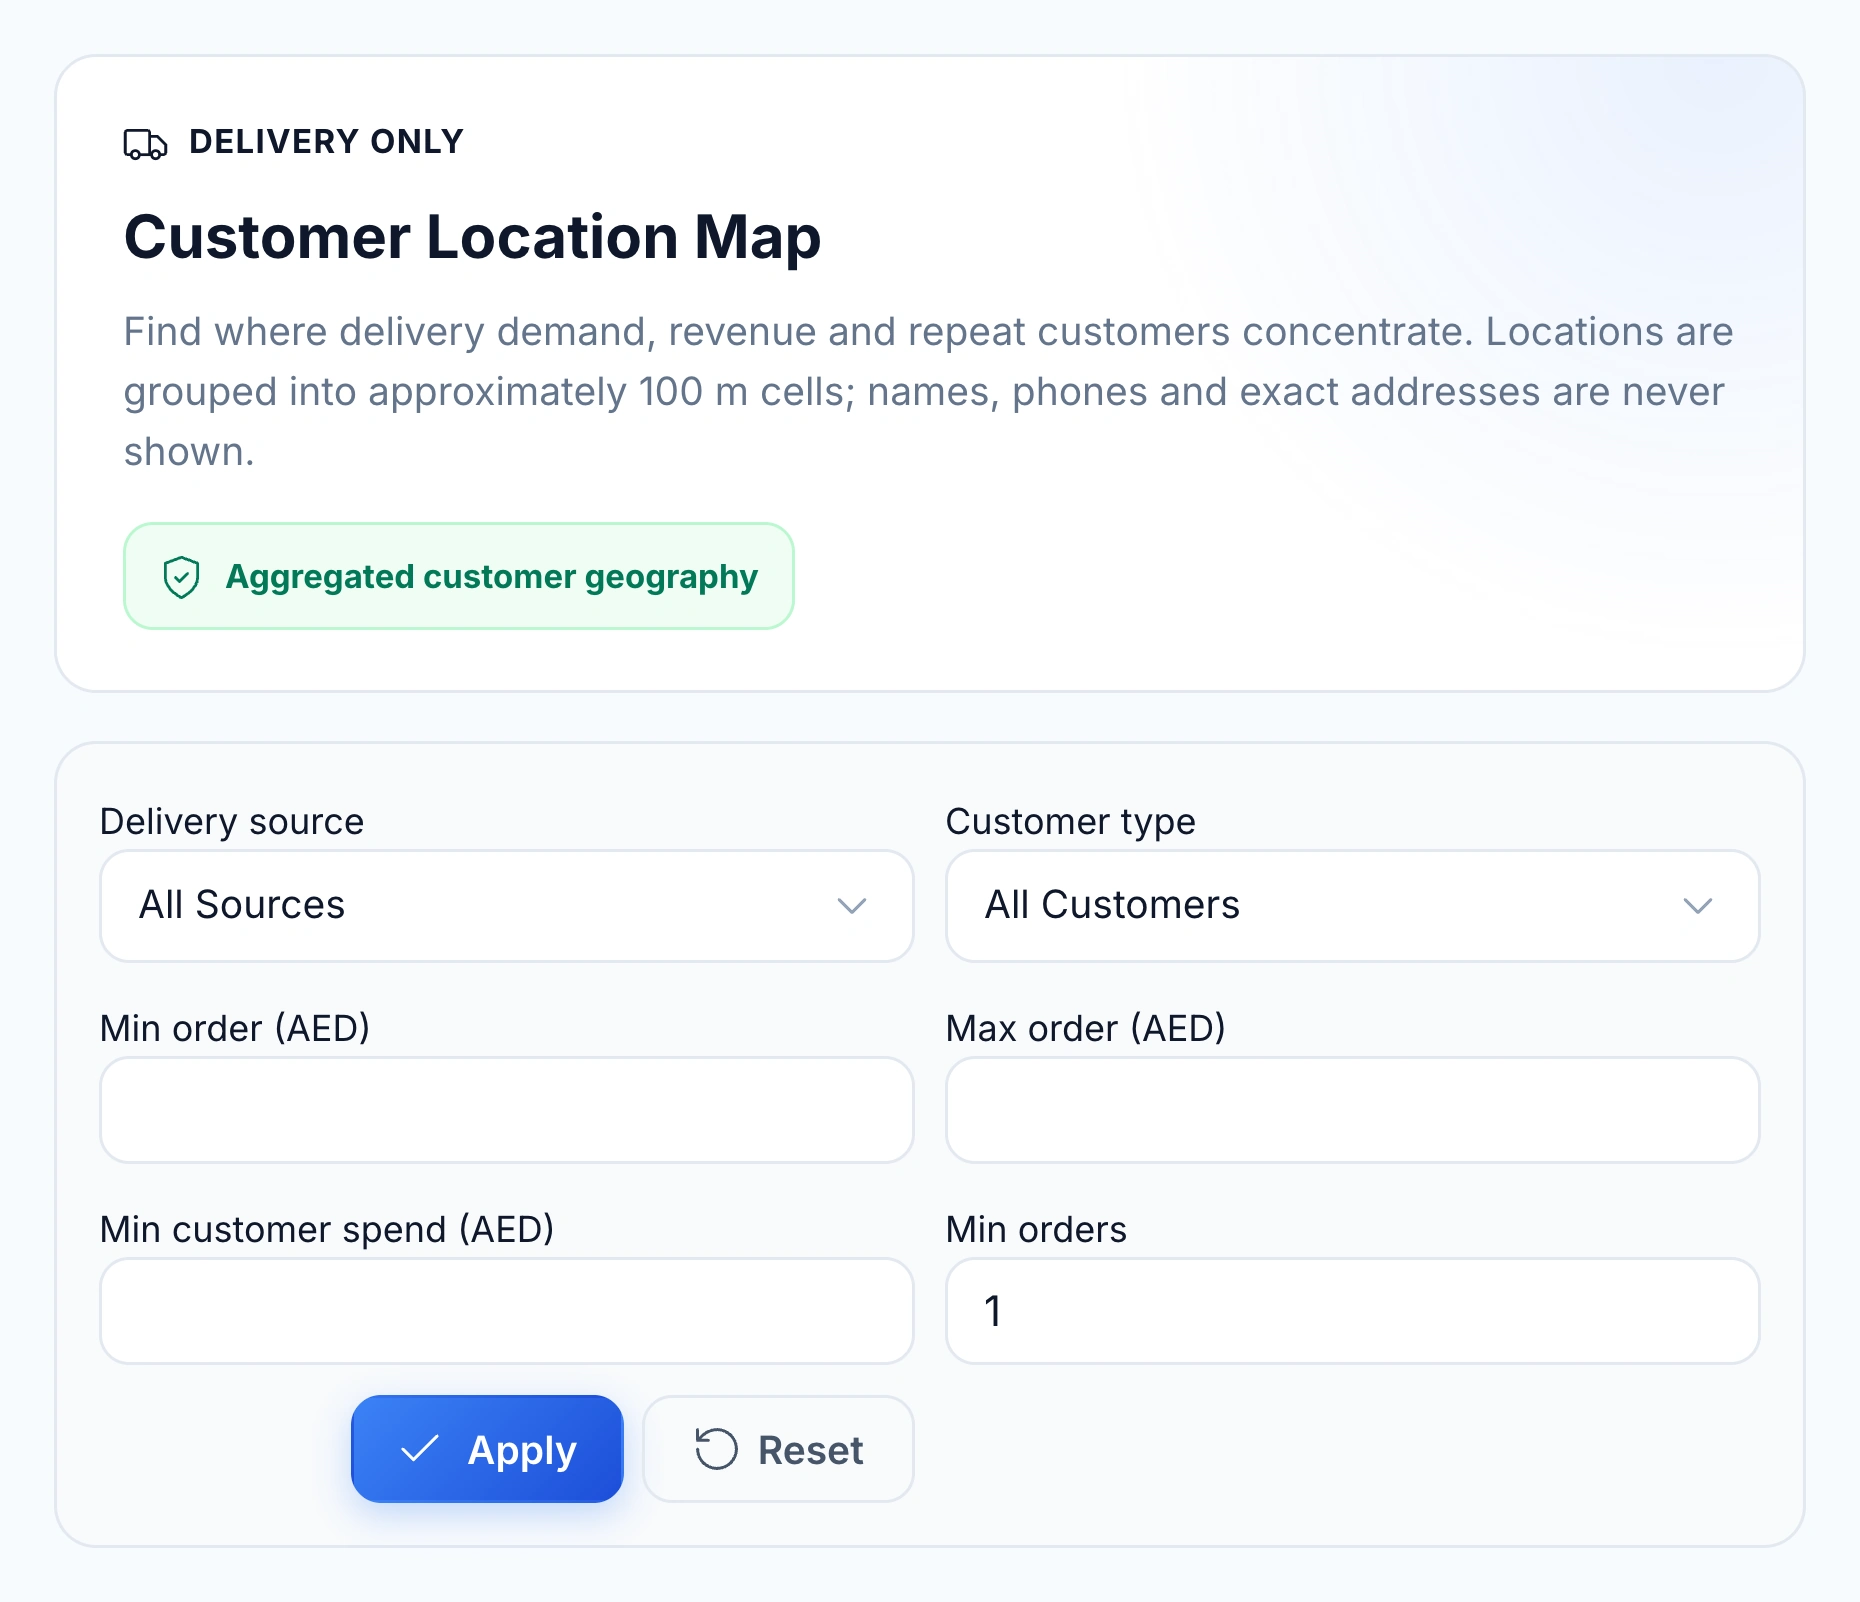
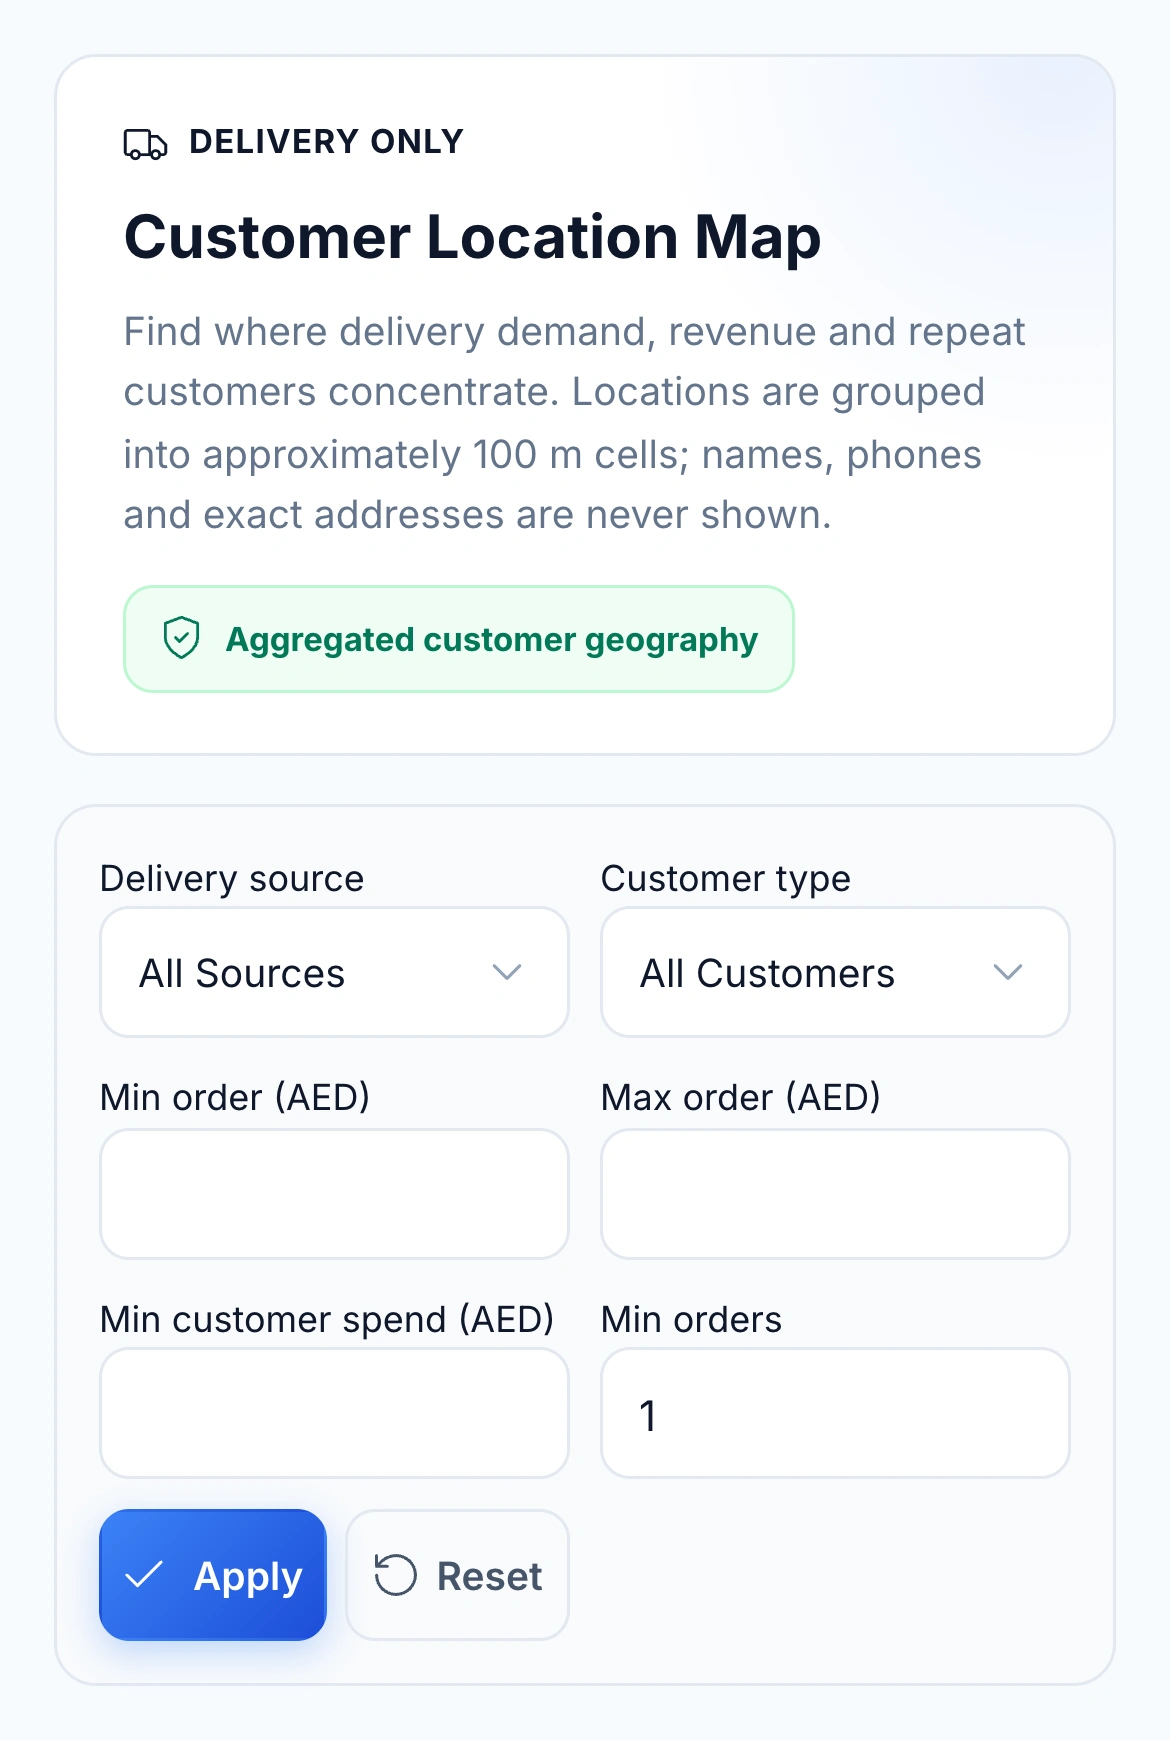
Use Customer Map to see where delivery orders, revenue and repeat customers concentrate. Compare areas by order value, customer spend, purchase frequency and delivery source when planning an offer or reviewing your catchment area.

Local advertising

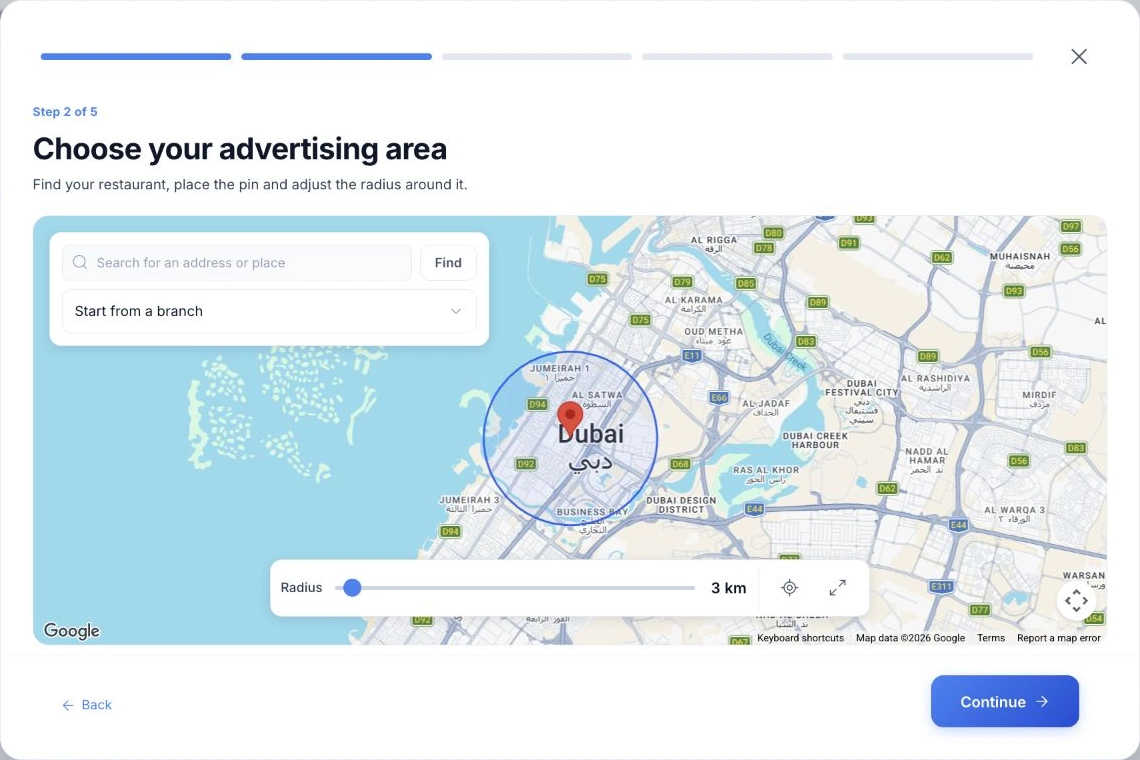
HoreX Google campaign setup with restaurant pin, 3 km advertising radius and Google map

Demand filters

Native Customer Map filters for delivery source, customer type, order value, spend and frequency

For local Google advertising, choose the restaurant, place the map pin and set the radius. Give each campaign its own goal, budget and message. Connected Google profiles and tagged ordering or booking links help nearby guests find the next step.

  • Delivery demand by area
  • New, returning and repeat-customer filters
  • Map pin and adjustable advertising radius
  • Direct-order or restaurant-visit campaign goals

04 / UTM & CAMPAIGN ANALYTICS

Know which link, source and offer led to the order.

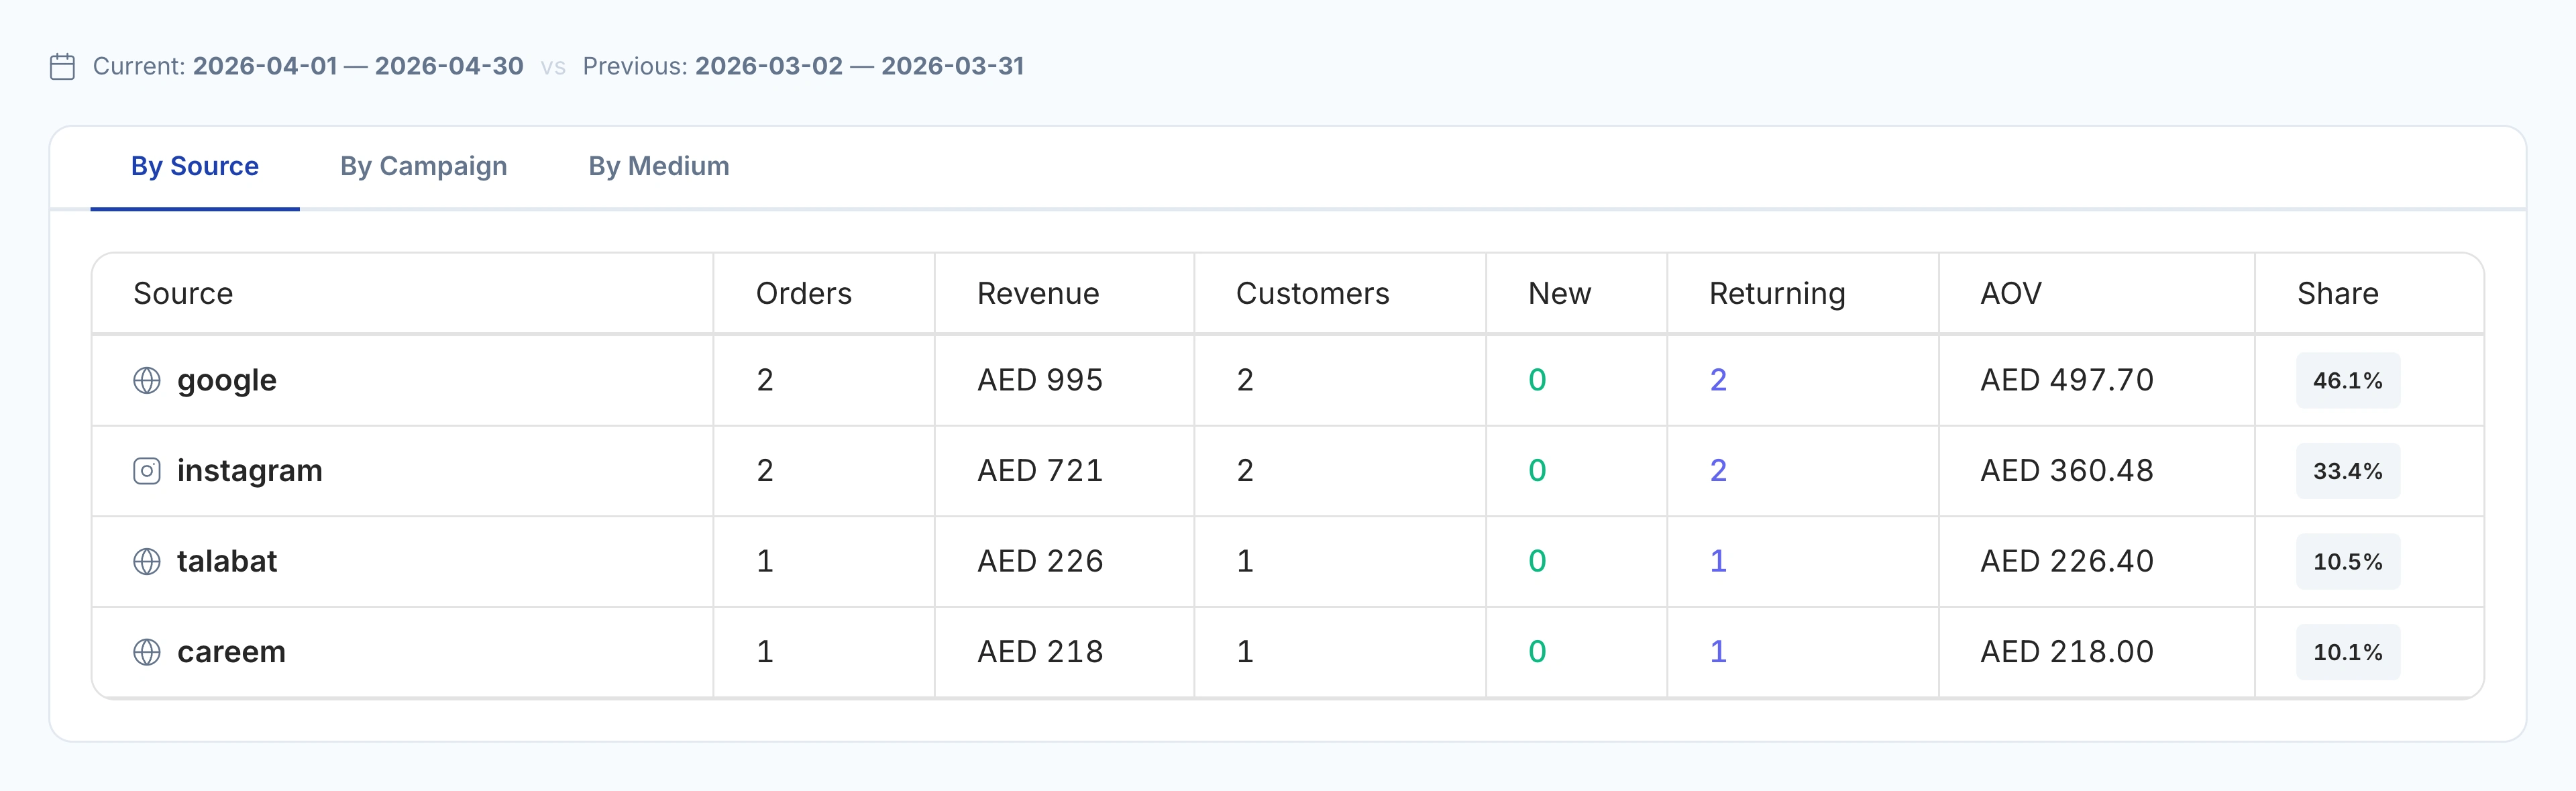
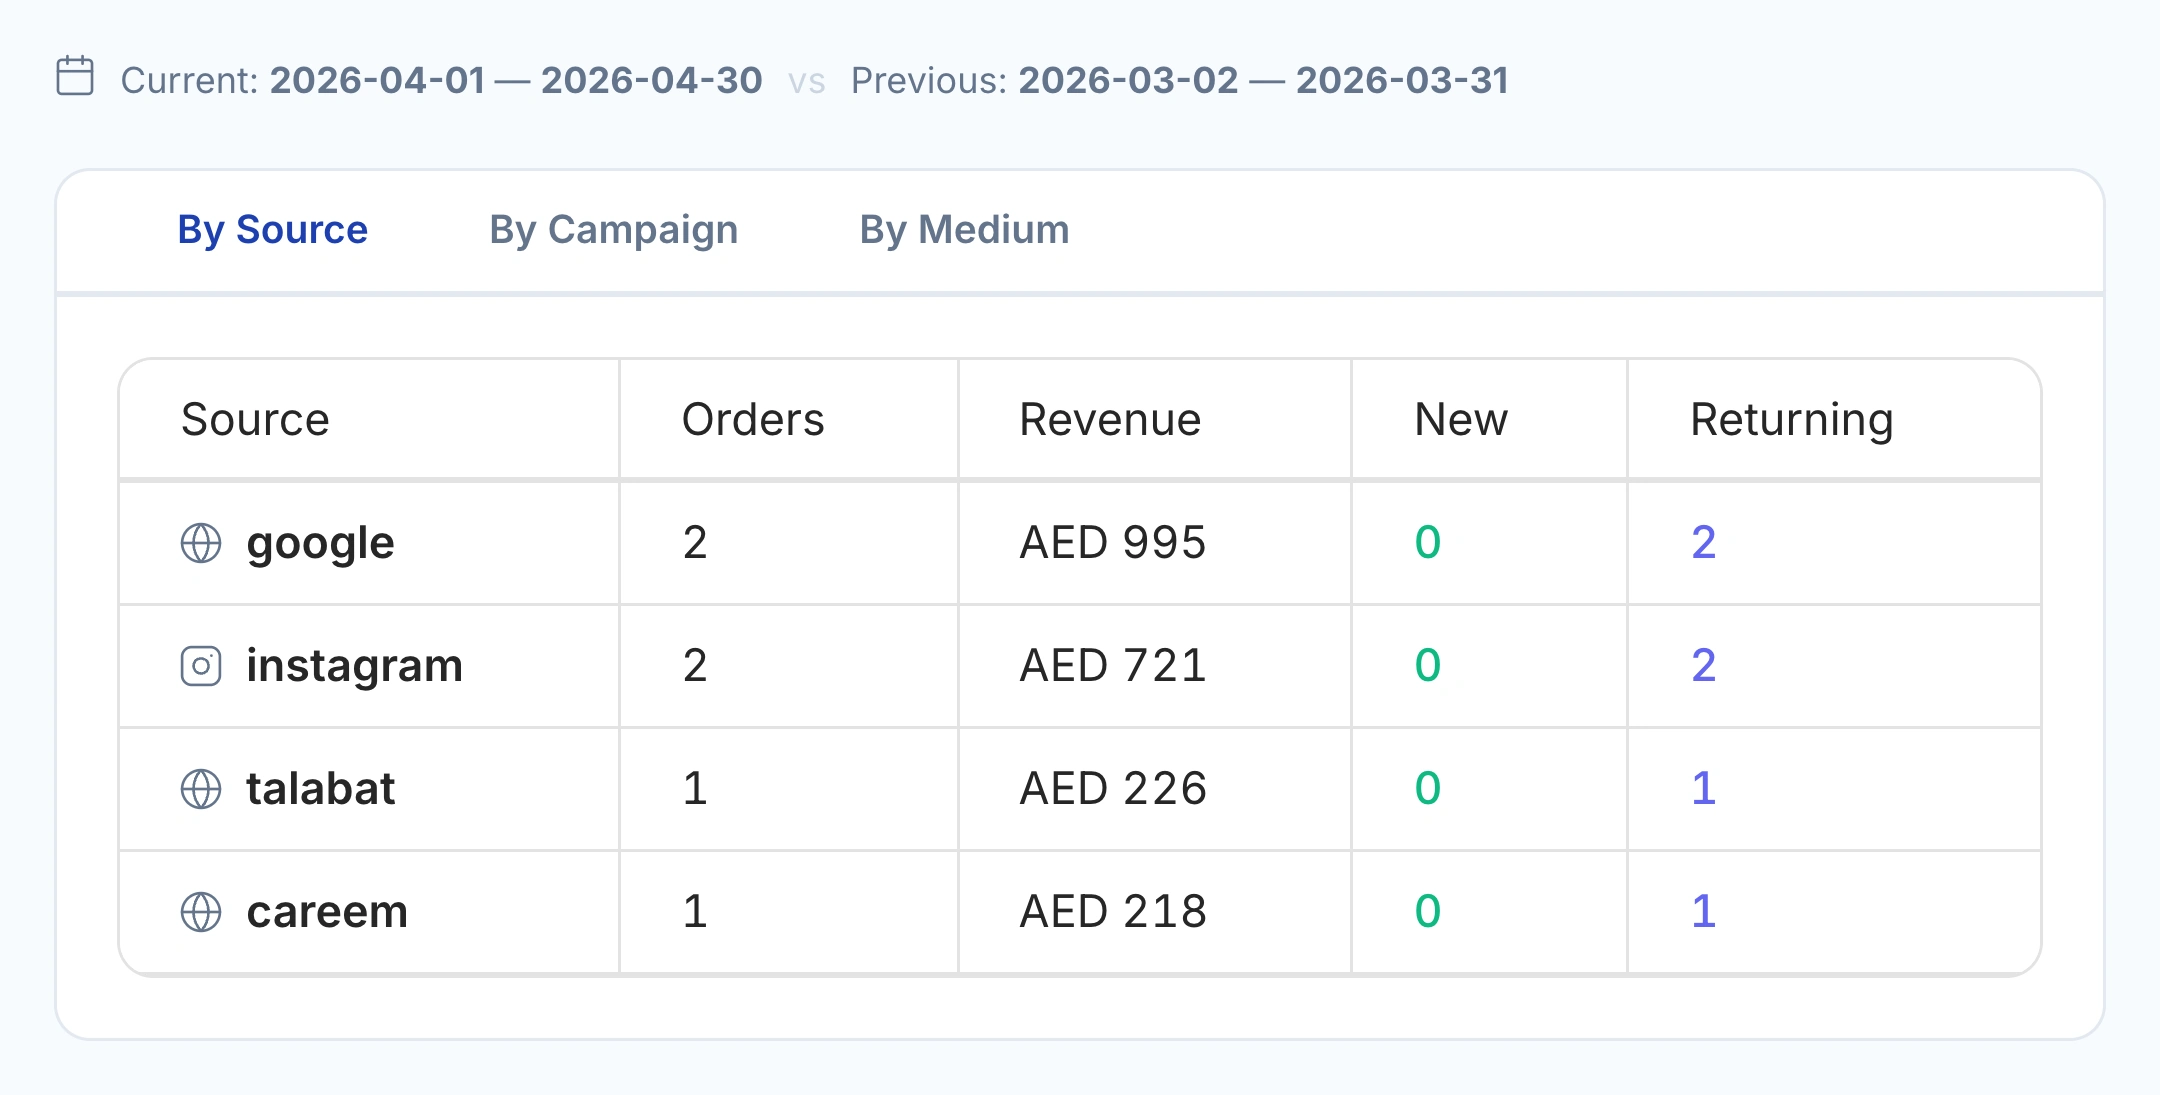
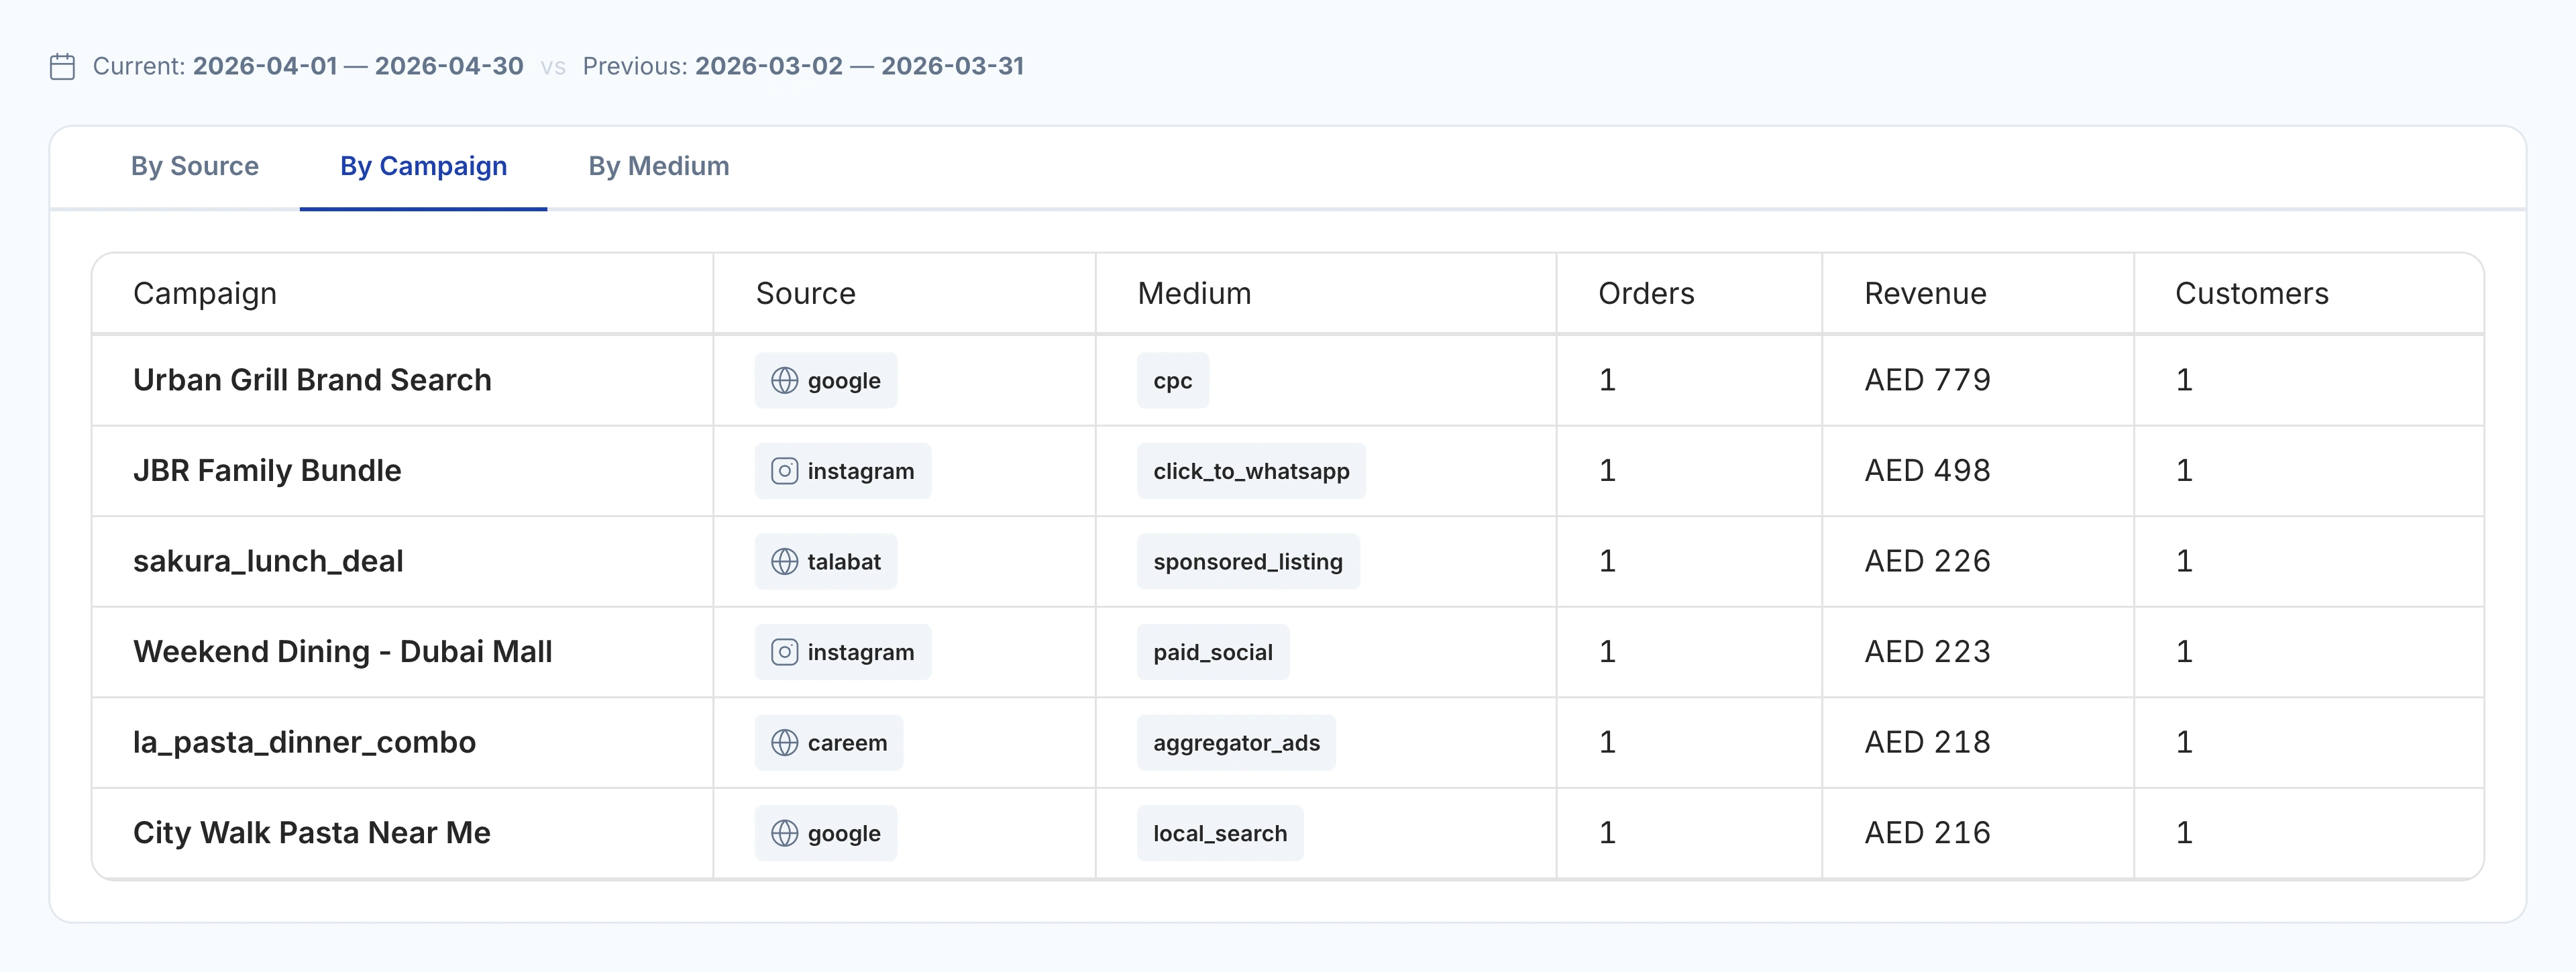
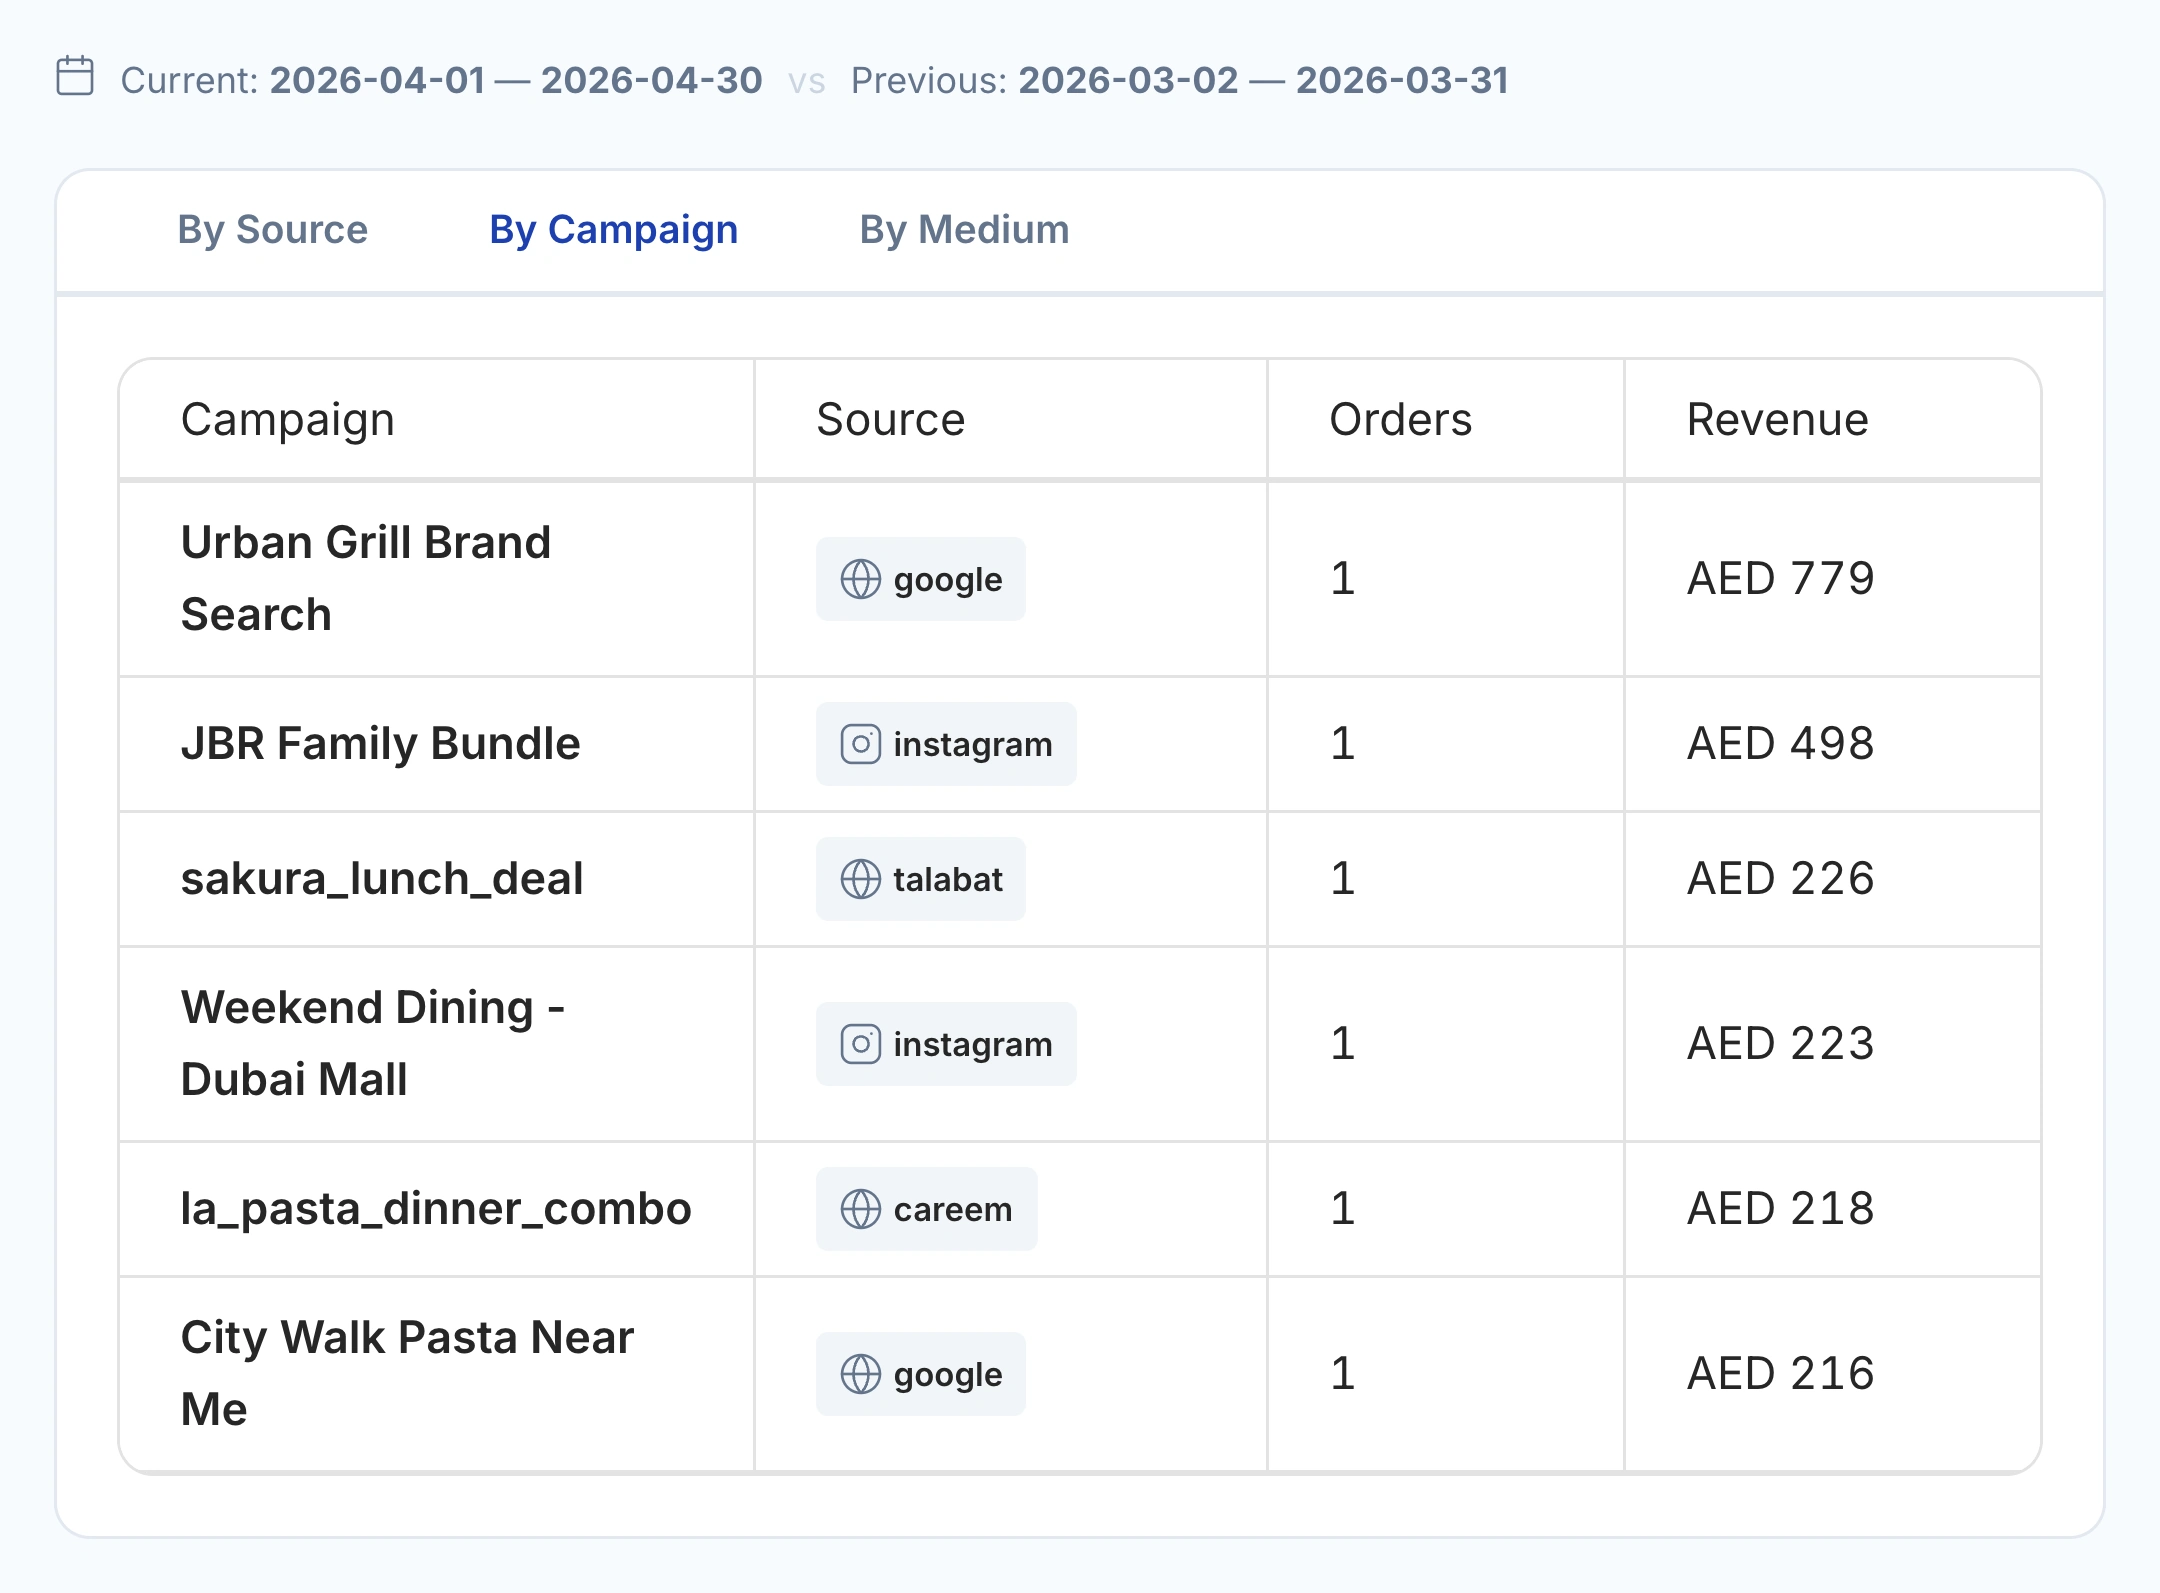
Compare UTM source, medium and campaign across tagged orders. An Instagram promotion, a Google search campaign and a partner link each keep their own place in the report. See order count, revenue, average order value and the share of new or returning guests.

Open the underlying orders when you need the detail. Promo-code reporting adds another view of an offer: how often it was used, the discounts applied and what those guests spent. Use the same tags consistently in your advertising, messages and booking links.

  • Source, medium and campaign breakdowns
  • Current period versus the previous period
  • New and returning customer revenue
  • Promo-code usage and discounts

By source

Native UTM report comparing Google, Instagram and other tagged sources by orders, revenue and customers

By campaign

Native UTM campaign table with source, medium, order count and revenue
UTM campaign table with source, order count and revenue

05 / RETENTION & CUSTOMER VALUE

Find the guests worth bringing back.

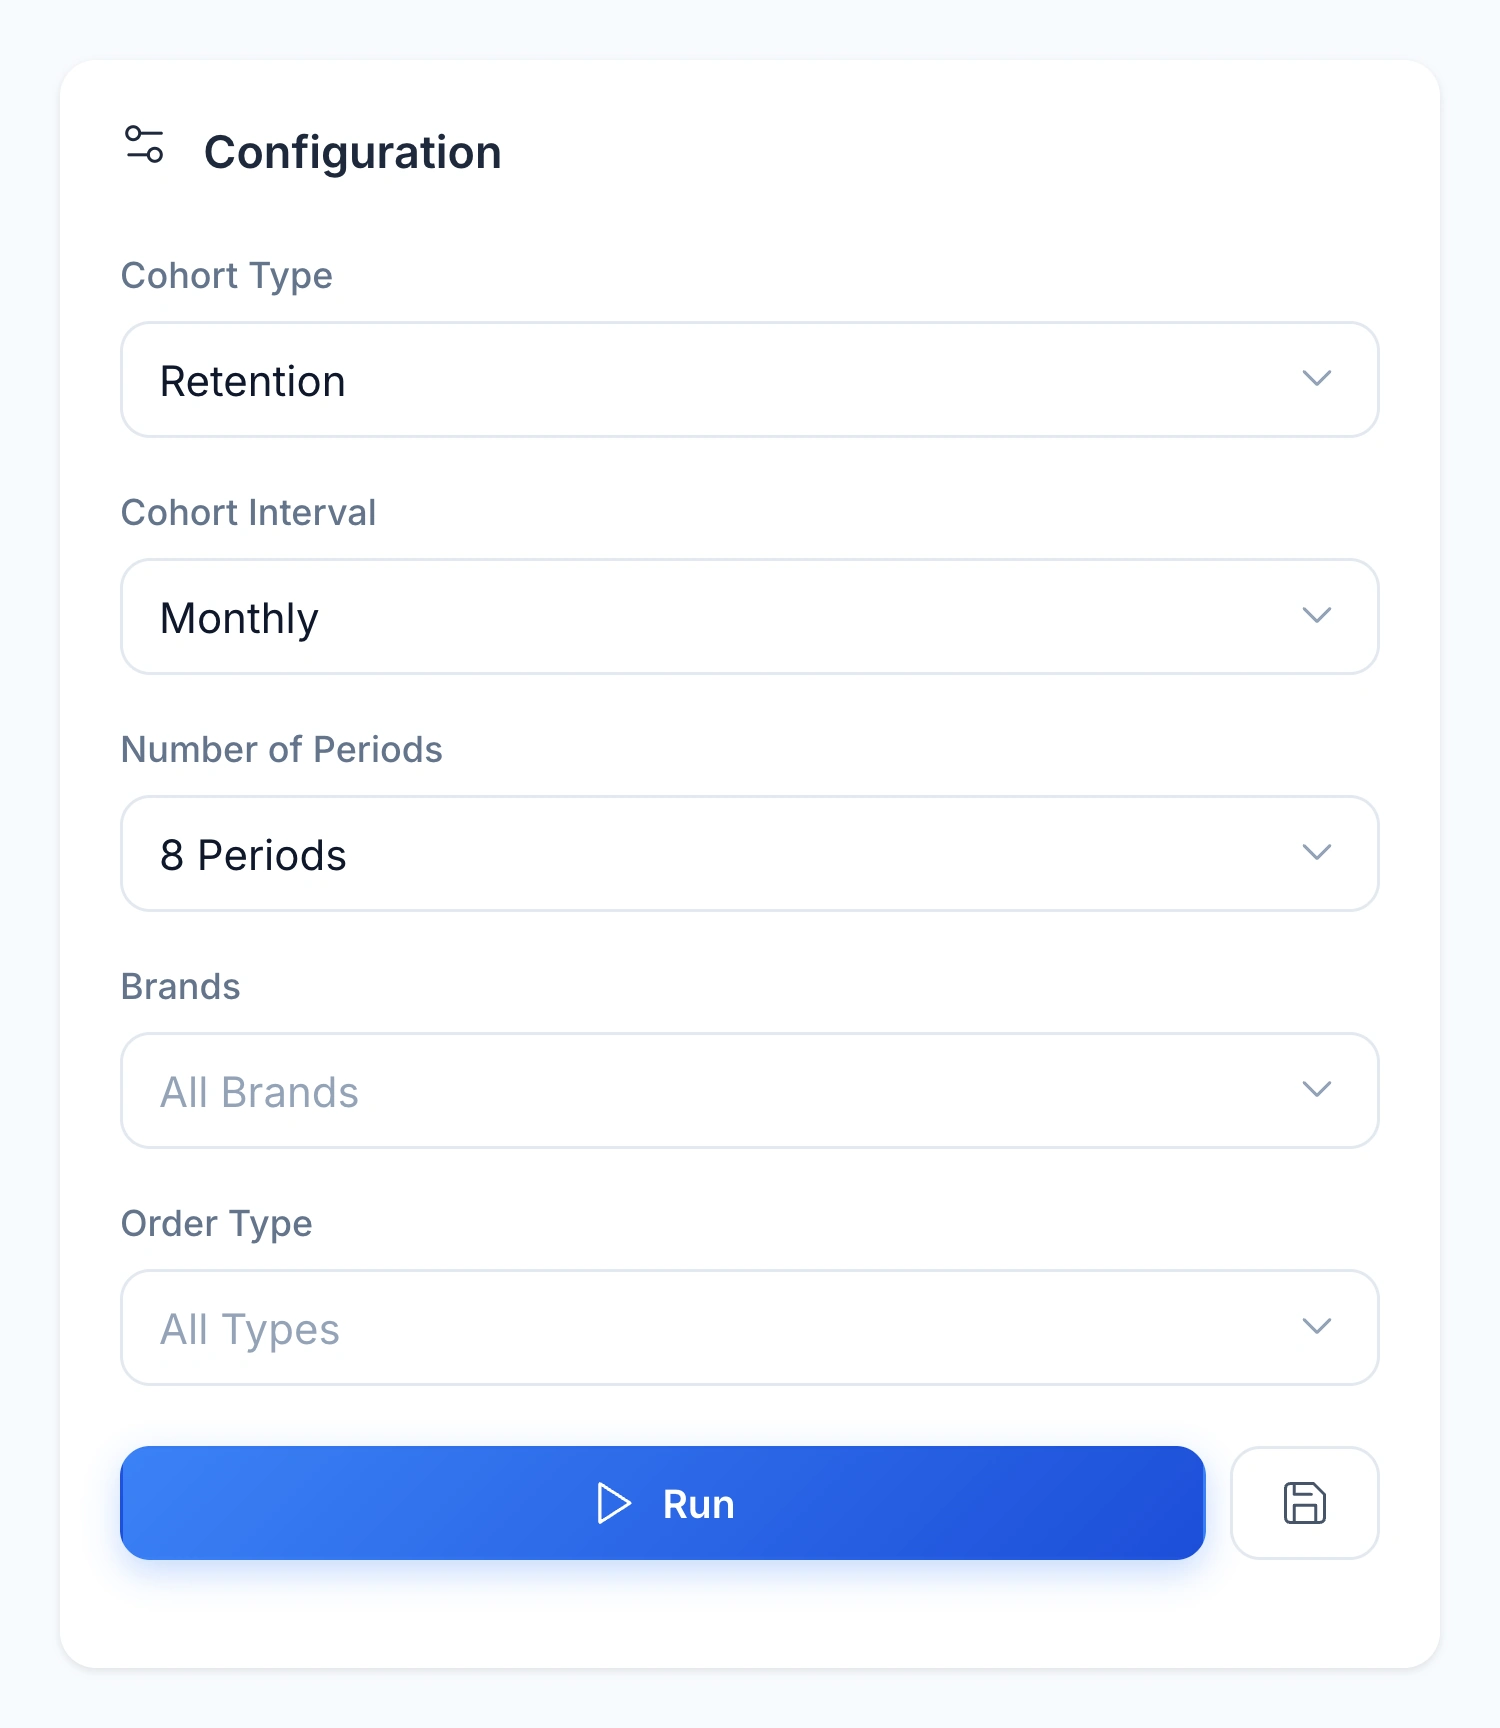
A first order is the beginning of the relationship. Follow acquisition cohorts over weeks or months to compare customer retention, revenue LTV and order frequency. Compare groups at the same stage of their history to see whether guests keep buying after the initial offer.

RFM segmentation adds a practical view for the next campaign: recent regulars, high-spending guests and customers whose visits have fallen away. Check the last order, purchase frequency and spending before deciding who should receive an invitation.

  • Weekly and monthly acquisition cohorts
  • Retention, revenue LTV and order frequency
  • RFM: recency, frequency and spending
  • Inactive-guest groups and individual history
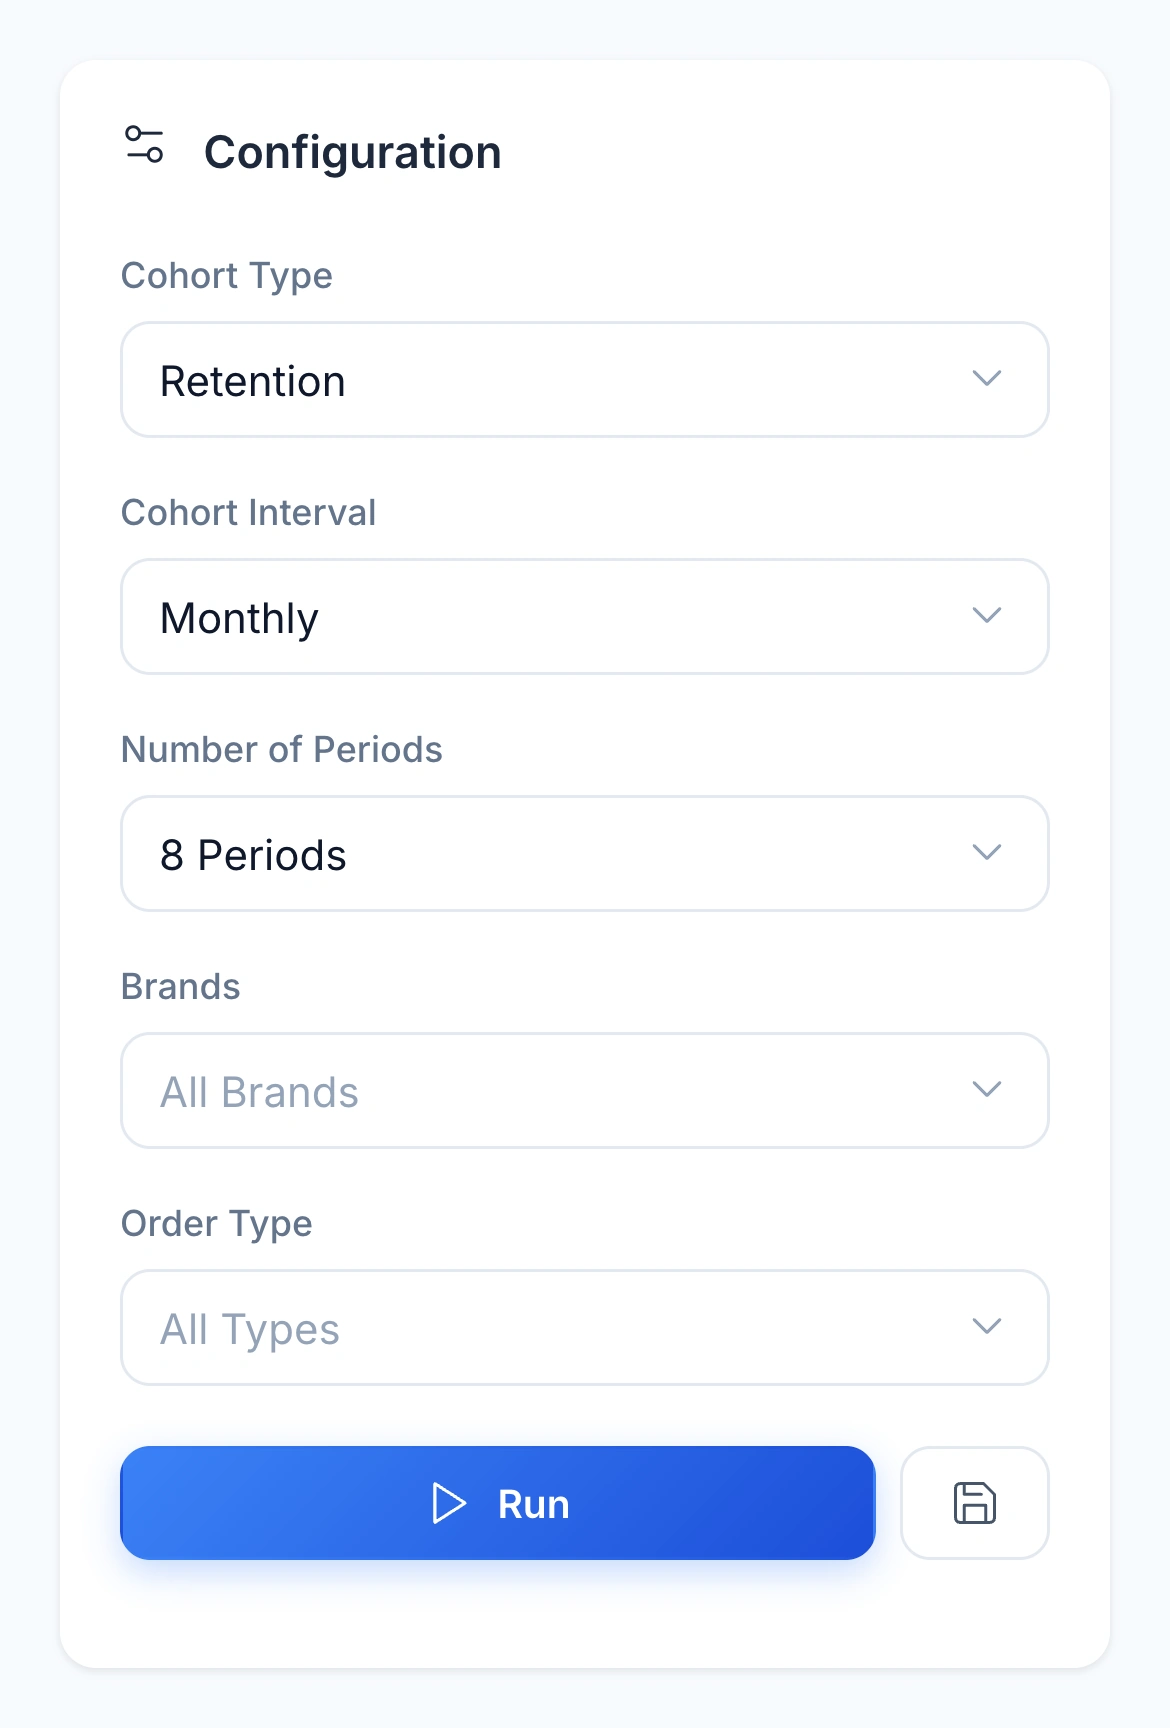
Native cohort builder with cohort type, monthly interval, period count, brands and order-type controls

06 / AUDIENCES & CAMPAIGNS

Turn the analysis into a reason to return.

Choose the guests, shape the offer and measure the response. Audiences use the same customer and order history as your reports, so the next campaign can reflect what people actually buy.

Customer history → relevant follow-up → results

Be specific about who should hear from you.

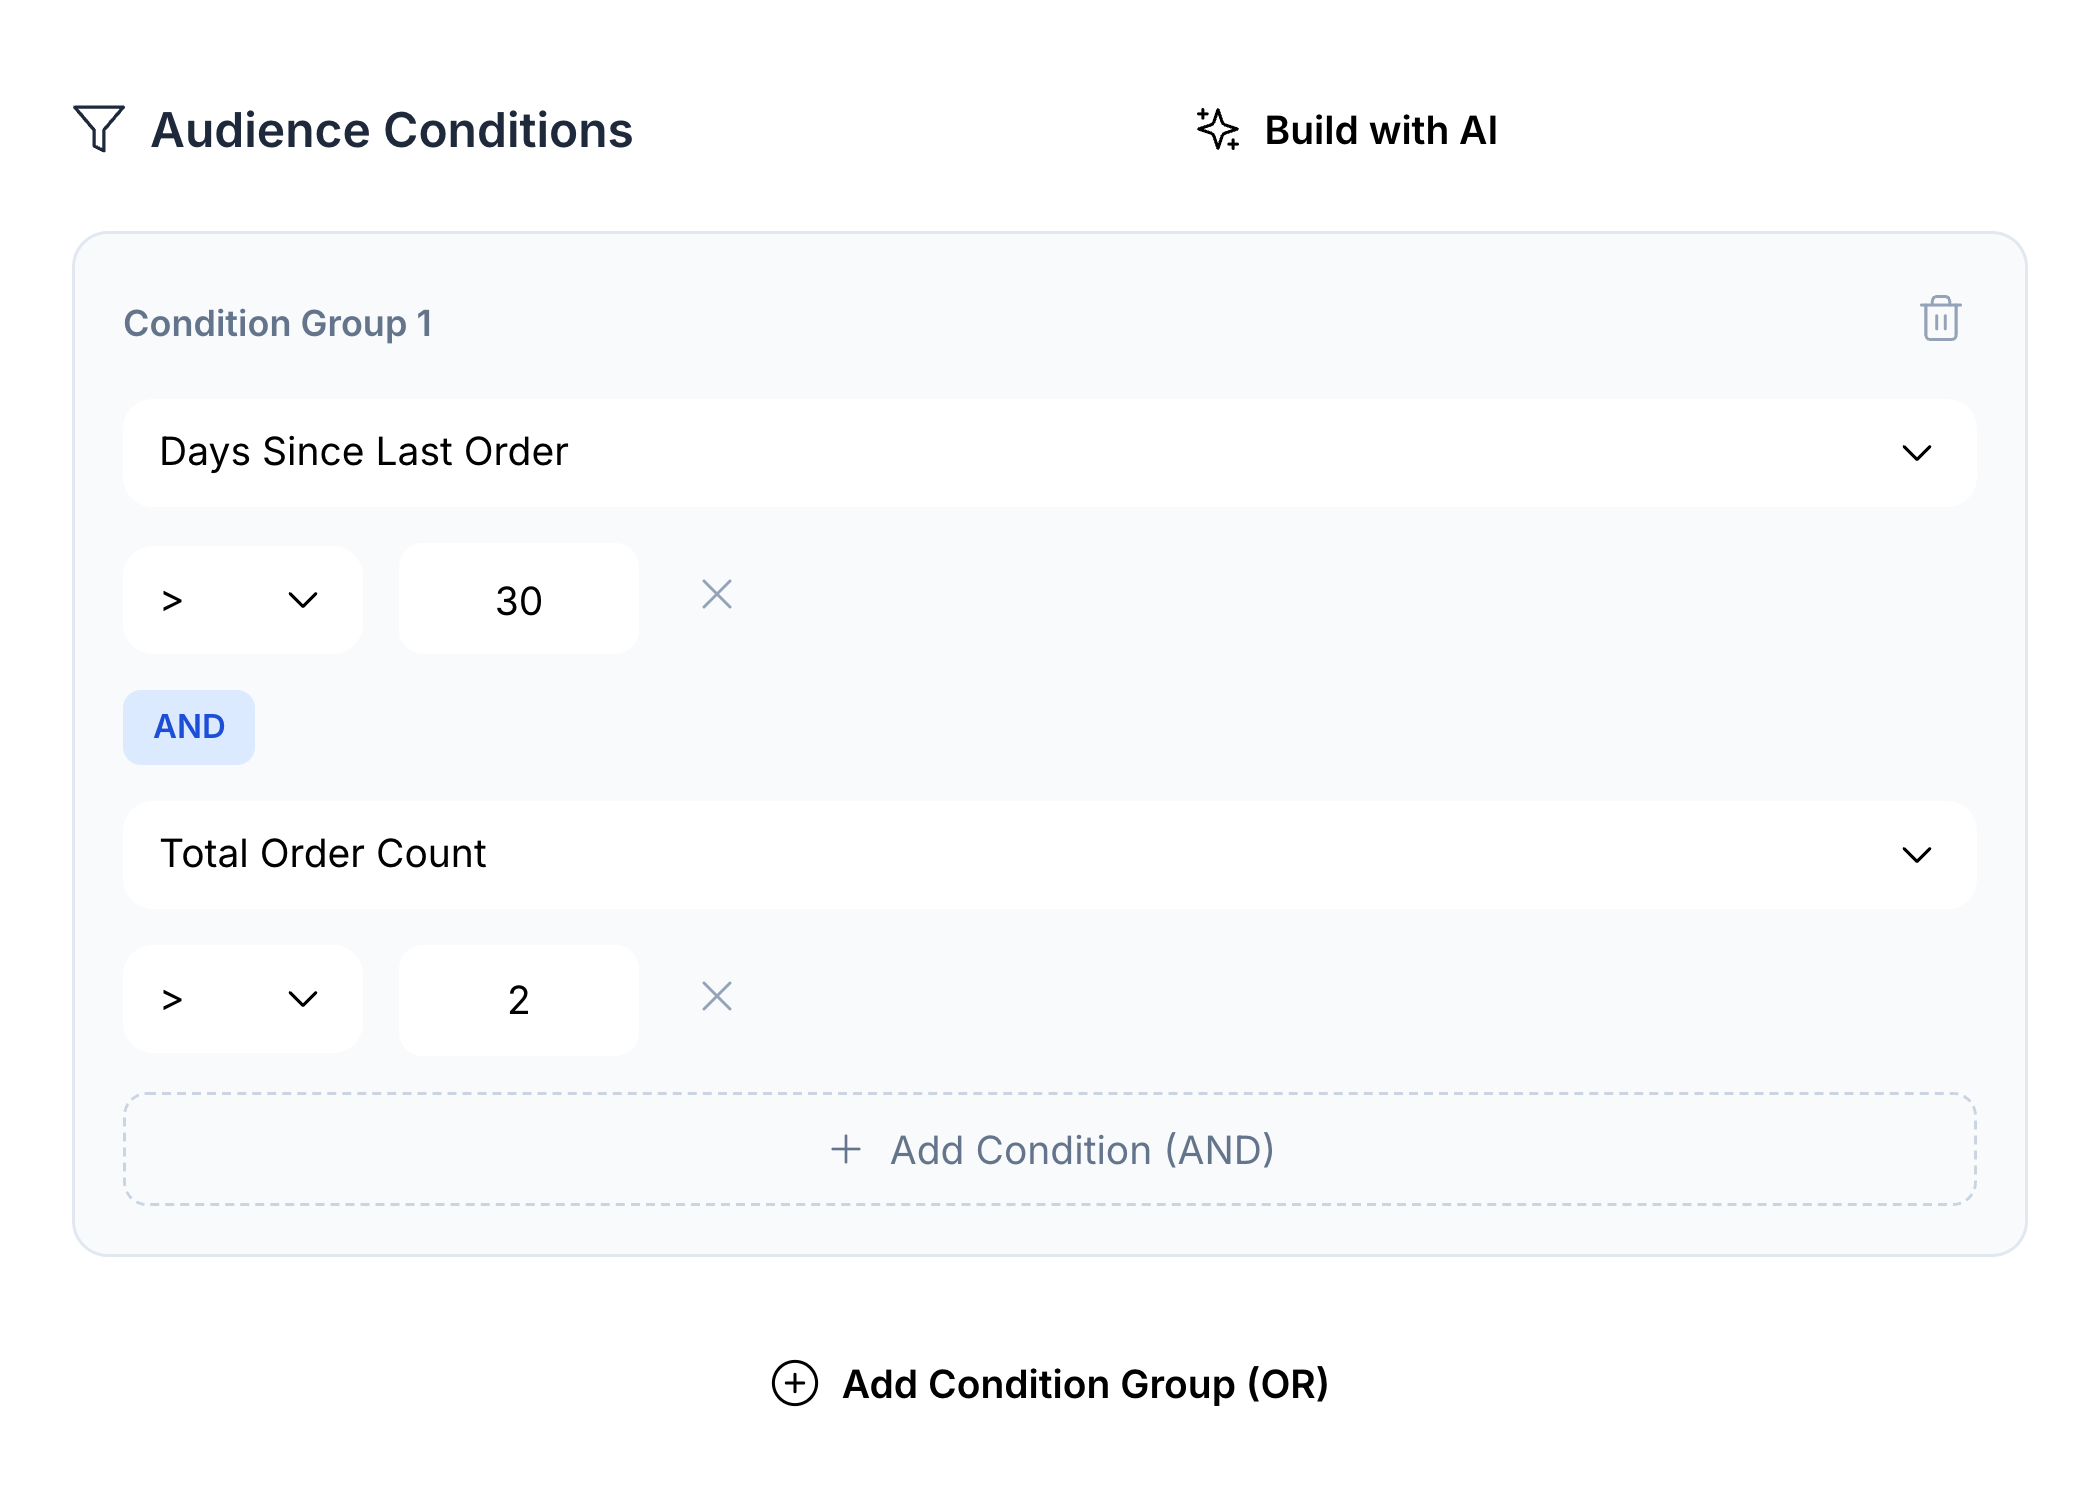
Combine conditions for spending, last order, dishes, brand, branch or purchase frequency. For example, choose repeat guests who have not ordered for more than 30 days, then check the audience before sending.

  • 45+ audience conditions
  • AND / OR condition groups
  • Audience preview and dynamic membership
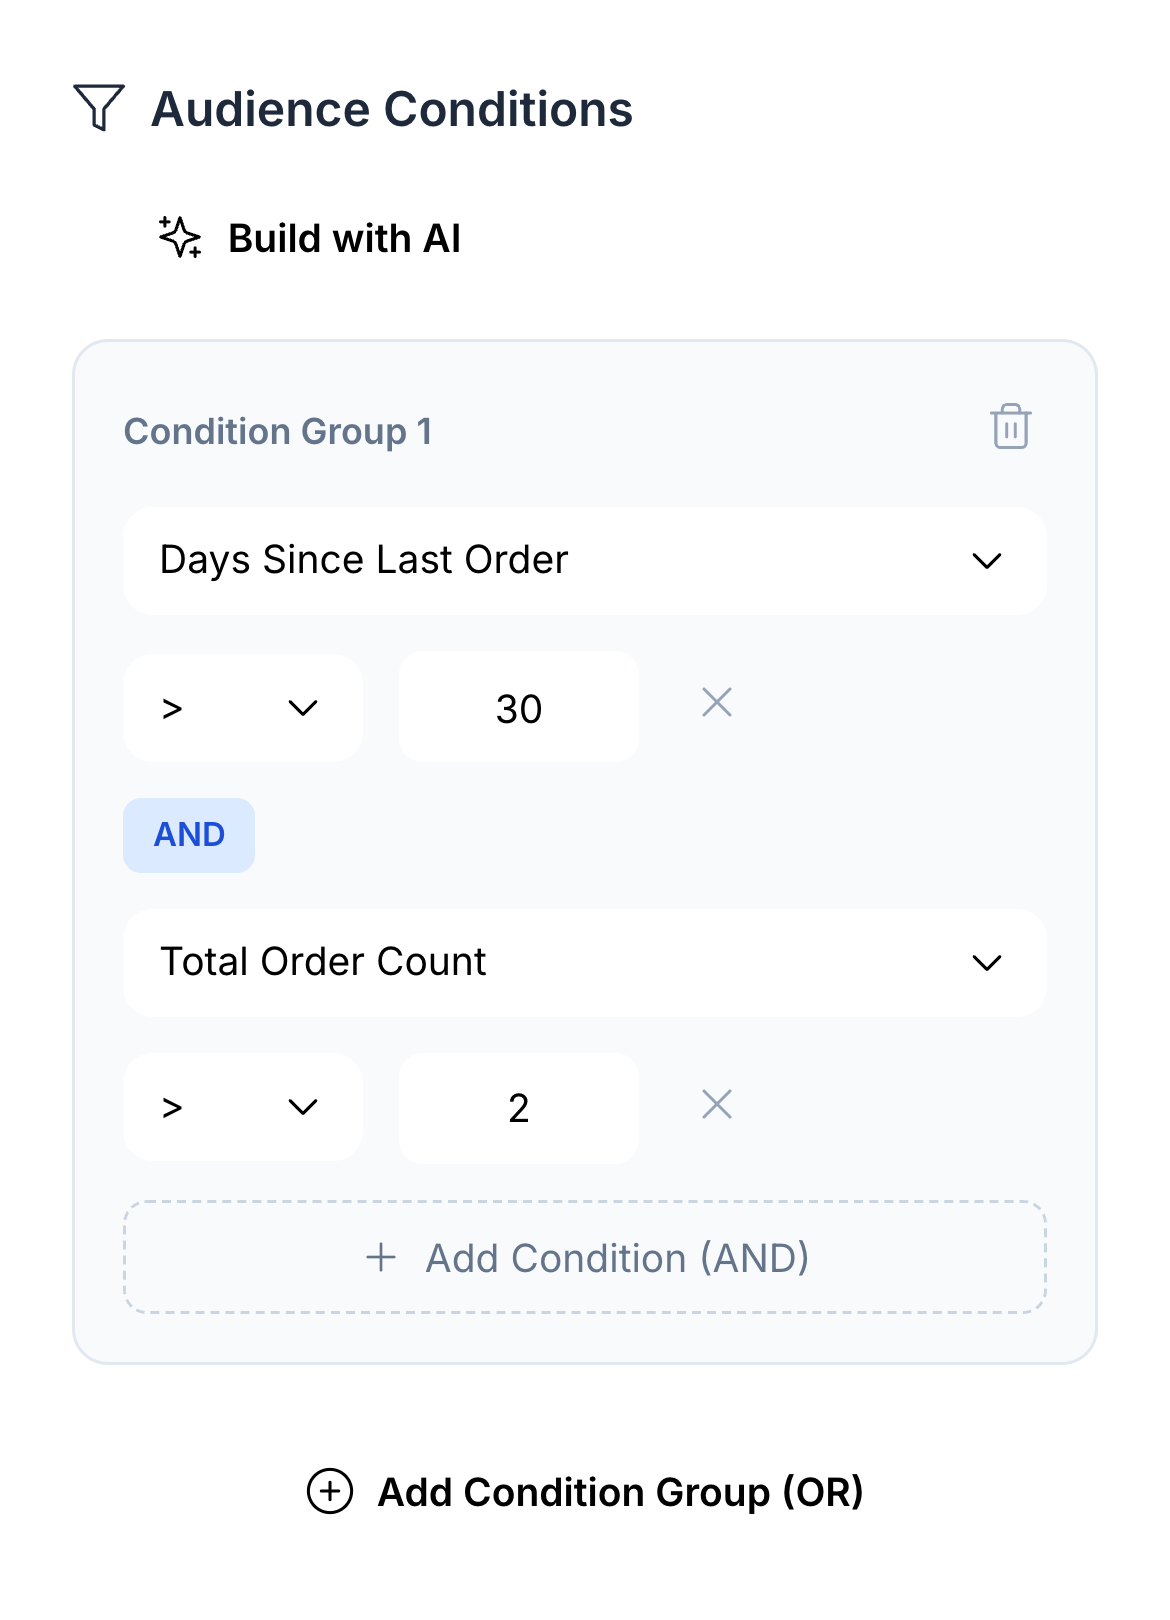
Native audience builder combining more than 30 days since last order with more than two orders

Match the invitation to the guest’s behaviour.

Use a targeted broadcast for a particular offer, or a ready-made loyalty journey for a birthday, visit milestone or period without an order. Choose the benefit, timing and message to suit your restaurant.

  • WhatsApp, app push and Wallet channels
  • Ready-made loyalty scenarios
  • Your timing, incentive and message
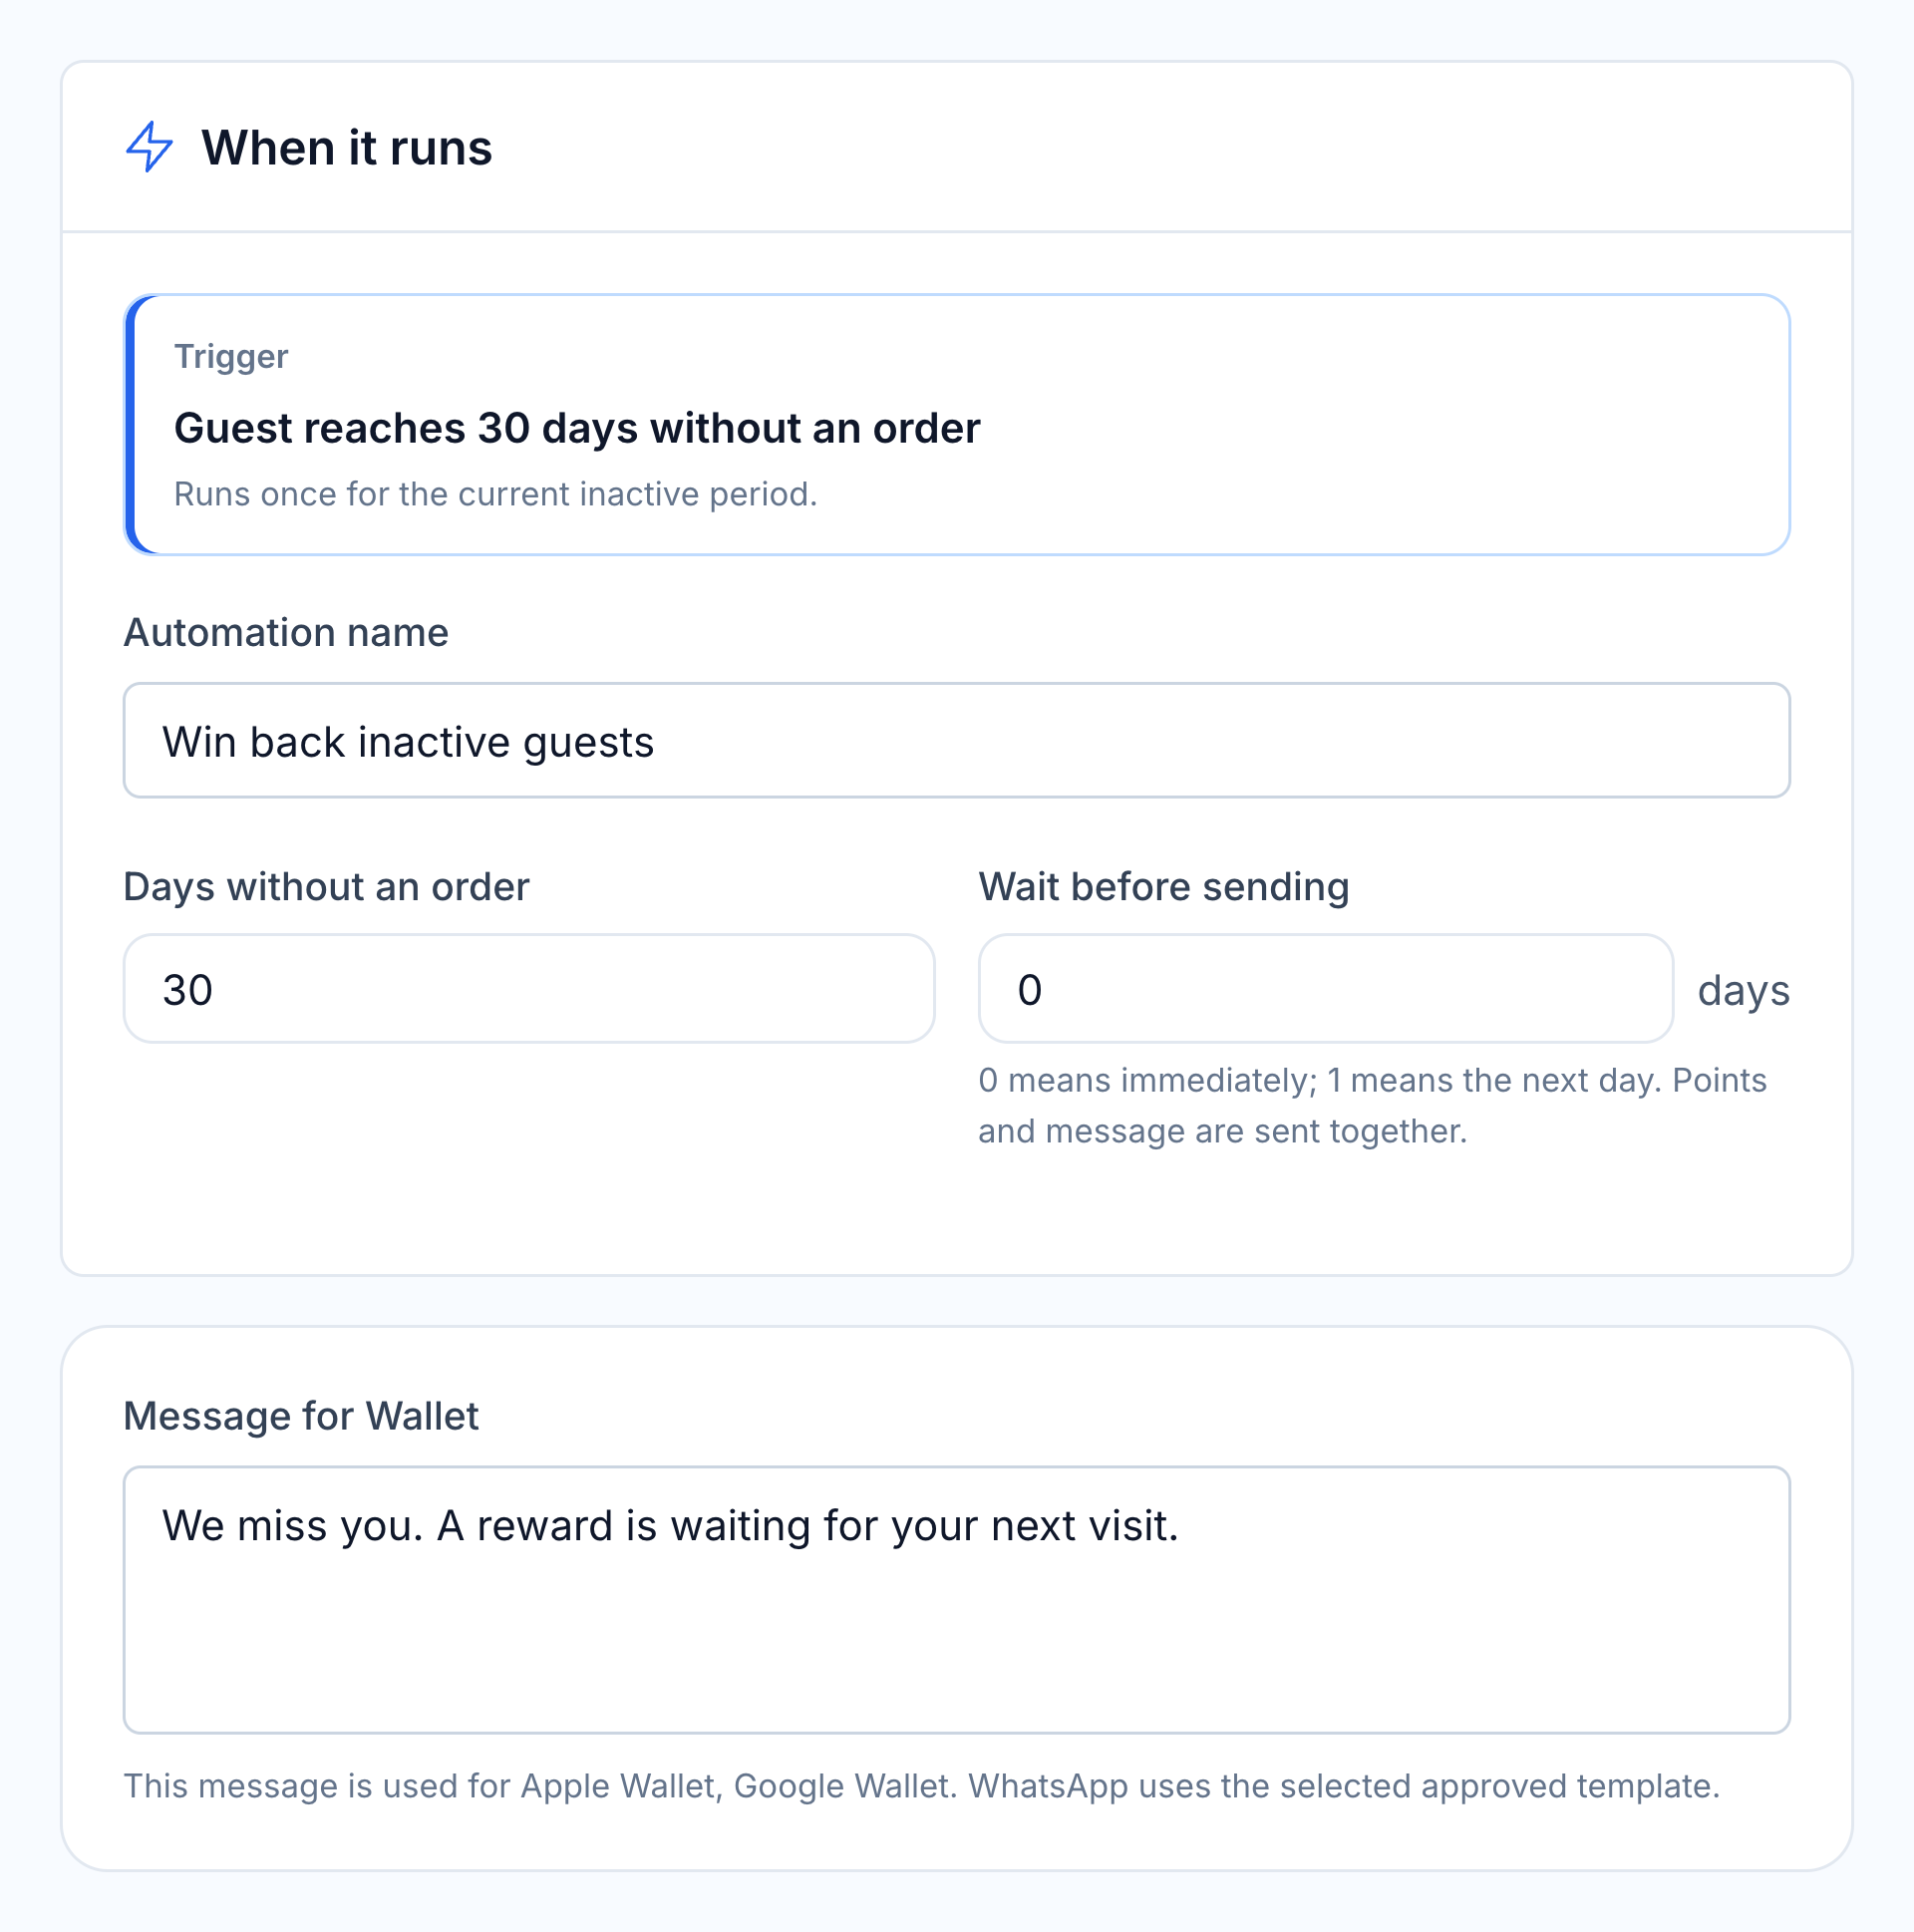
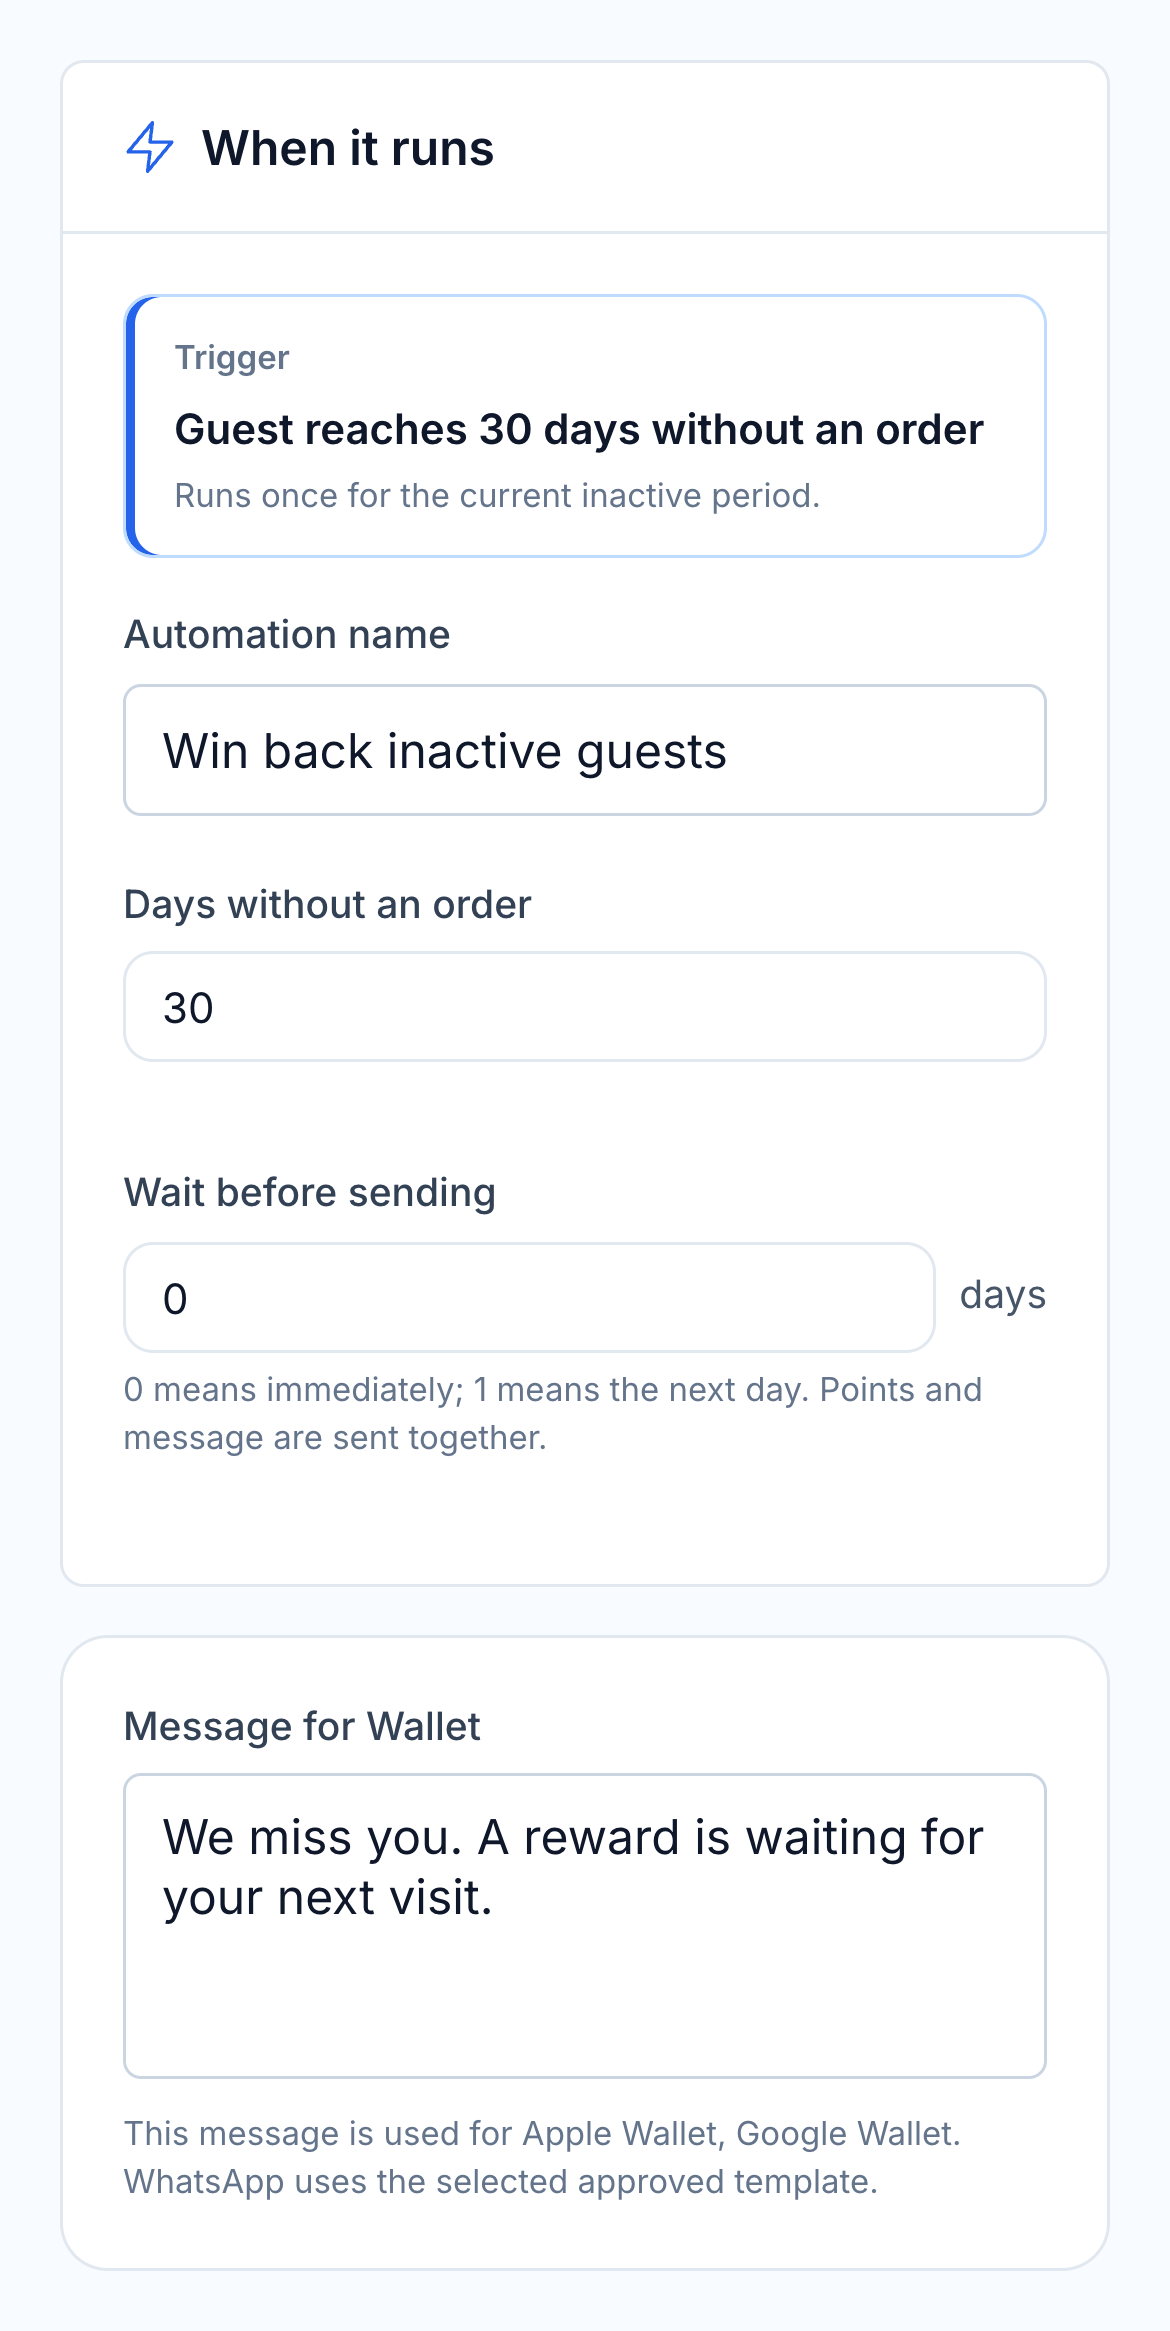
Native win-back automation with inactivity trigger, timing and editable guest message

Check reach, orders and the next visit.

Review sending and opening results for the campaign, then use tagged orders, promo-code activity and guest history to understand the sales that followed. Compare response by audience before repeating the offer.

  • Campaign delivery and opening results
  • UTM and promo-code order attribution
  • Repeat purchase and customer value
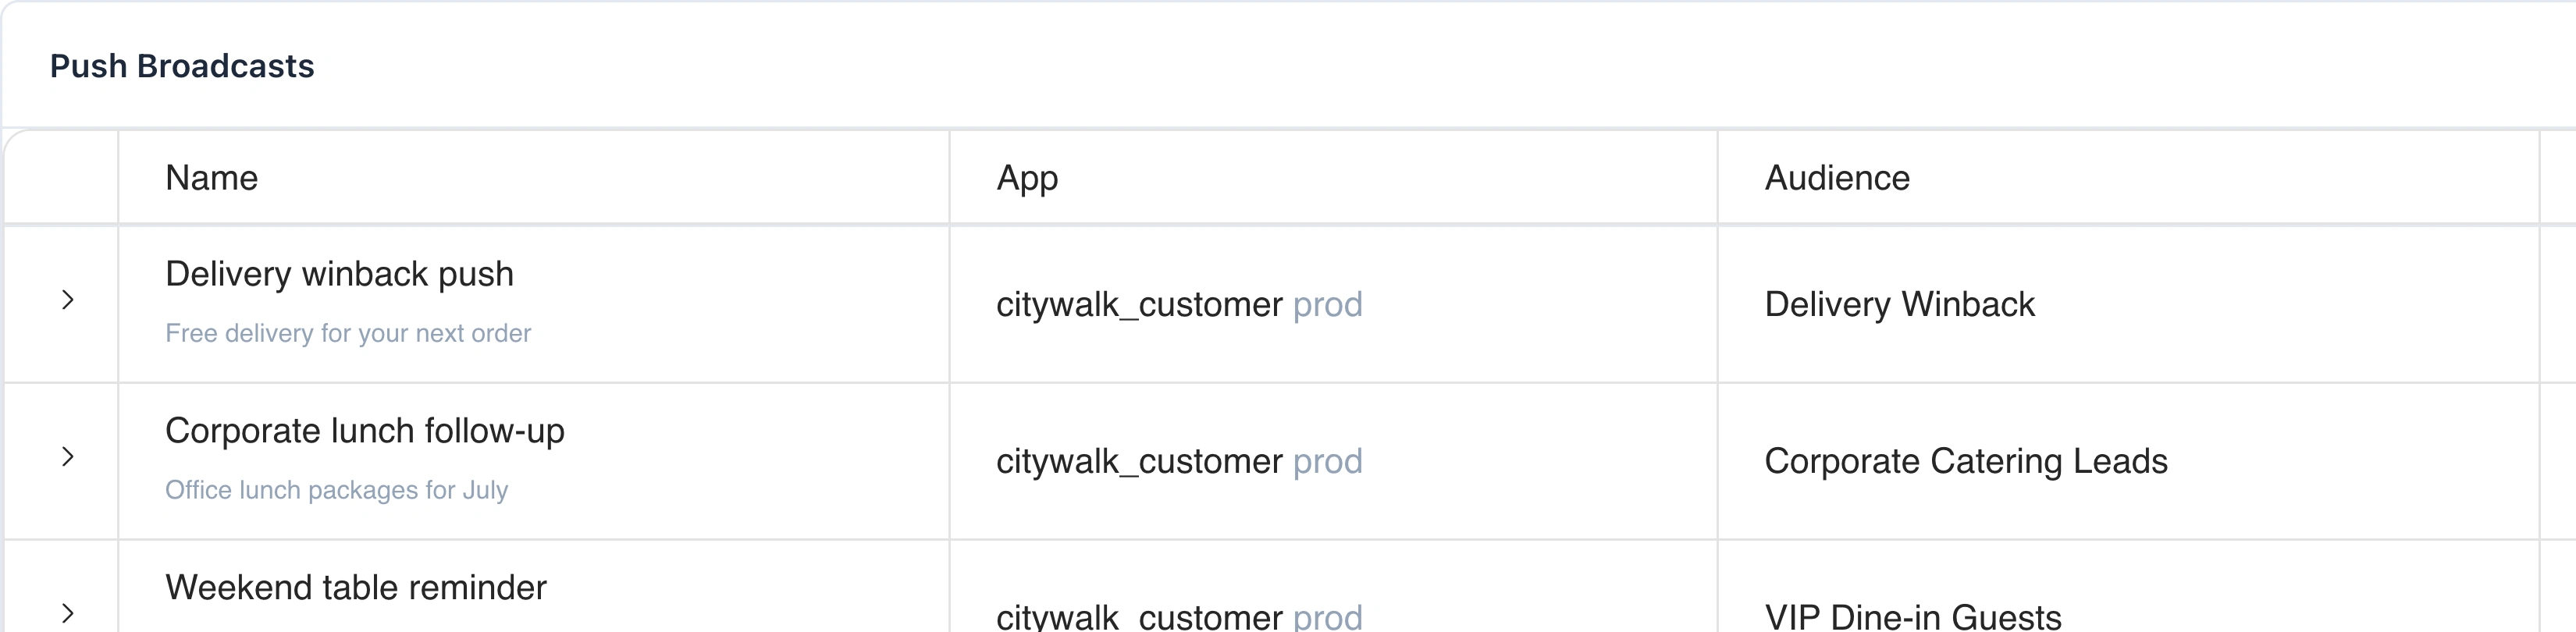
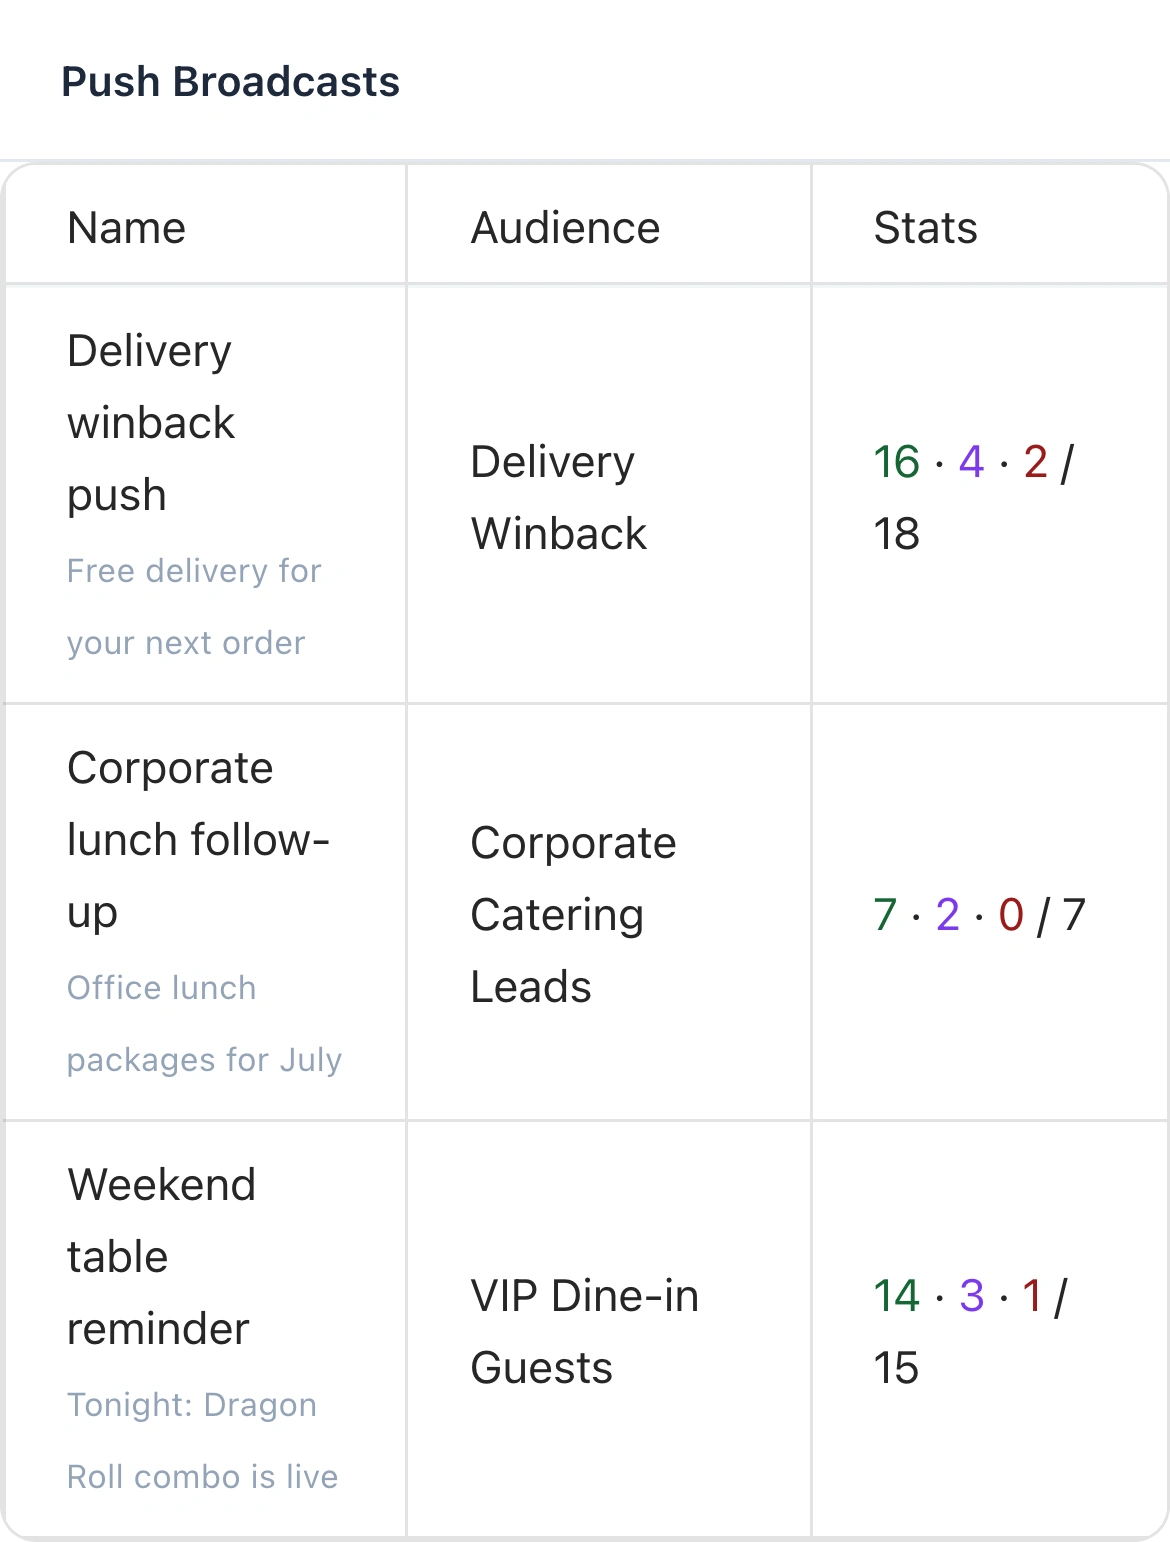
Native push broadcast history with campaign, audience, sent, opened and failed counts

07 / THE GUEST EXPERIENCE

Make the next visit easier to choose.

Reach guests through the channels they use with your restaurant: your customer app, Wallet card or connected WhatsApp. A useful offer, a favourite dish or a loyalty benefit gives the message a concrete reason to exist.

A regular guest looking at his phone in a neighbourhood cafe
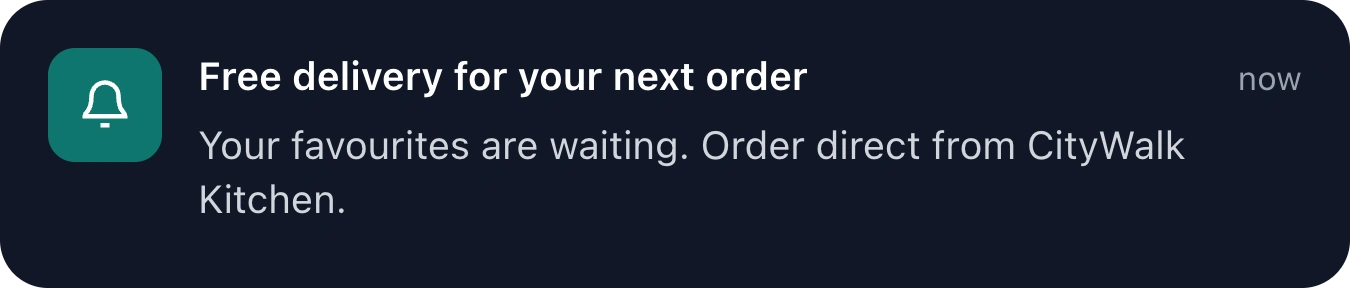
Customer app push preview: Free delivery for your next order. Your favourites are waiting. Order direct from CityWalk Kitchen.

The response returns to the same customer history. Your team can see the later order and continue the relationship with the guest across delivery and restaurant visits.

  • Relevant offers for selected audiences
  • App and Wallet engagement
  • Connected WhatsApp campaigns
  • Purchase history across channels

08 / REPORTS & MULTIPLE BRANCHES

Answer the next question without rebuilding a spreadsheet.

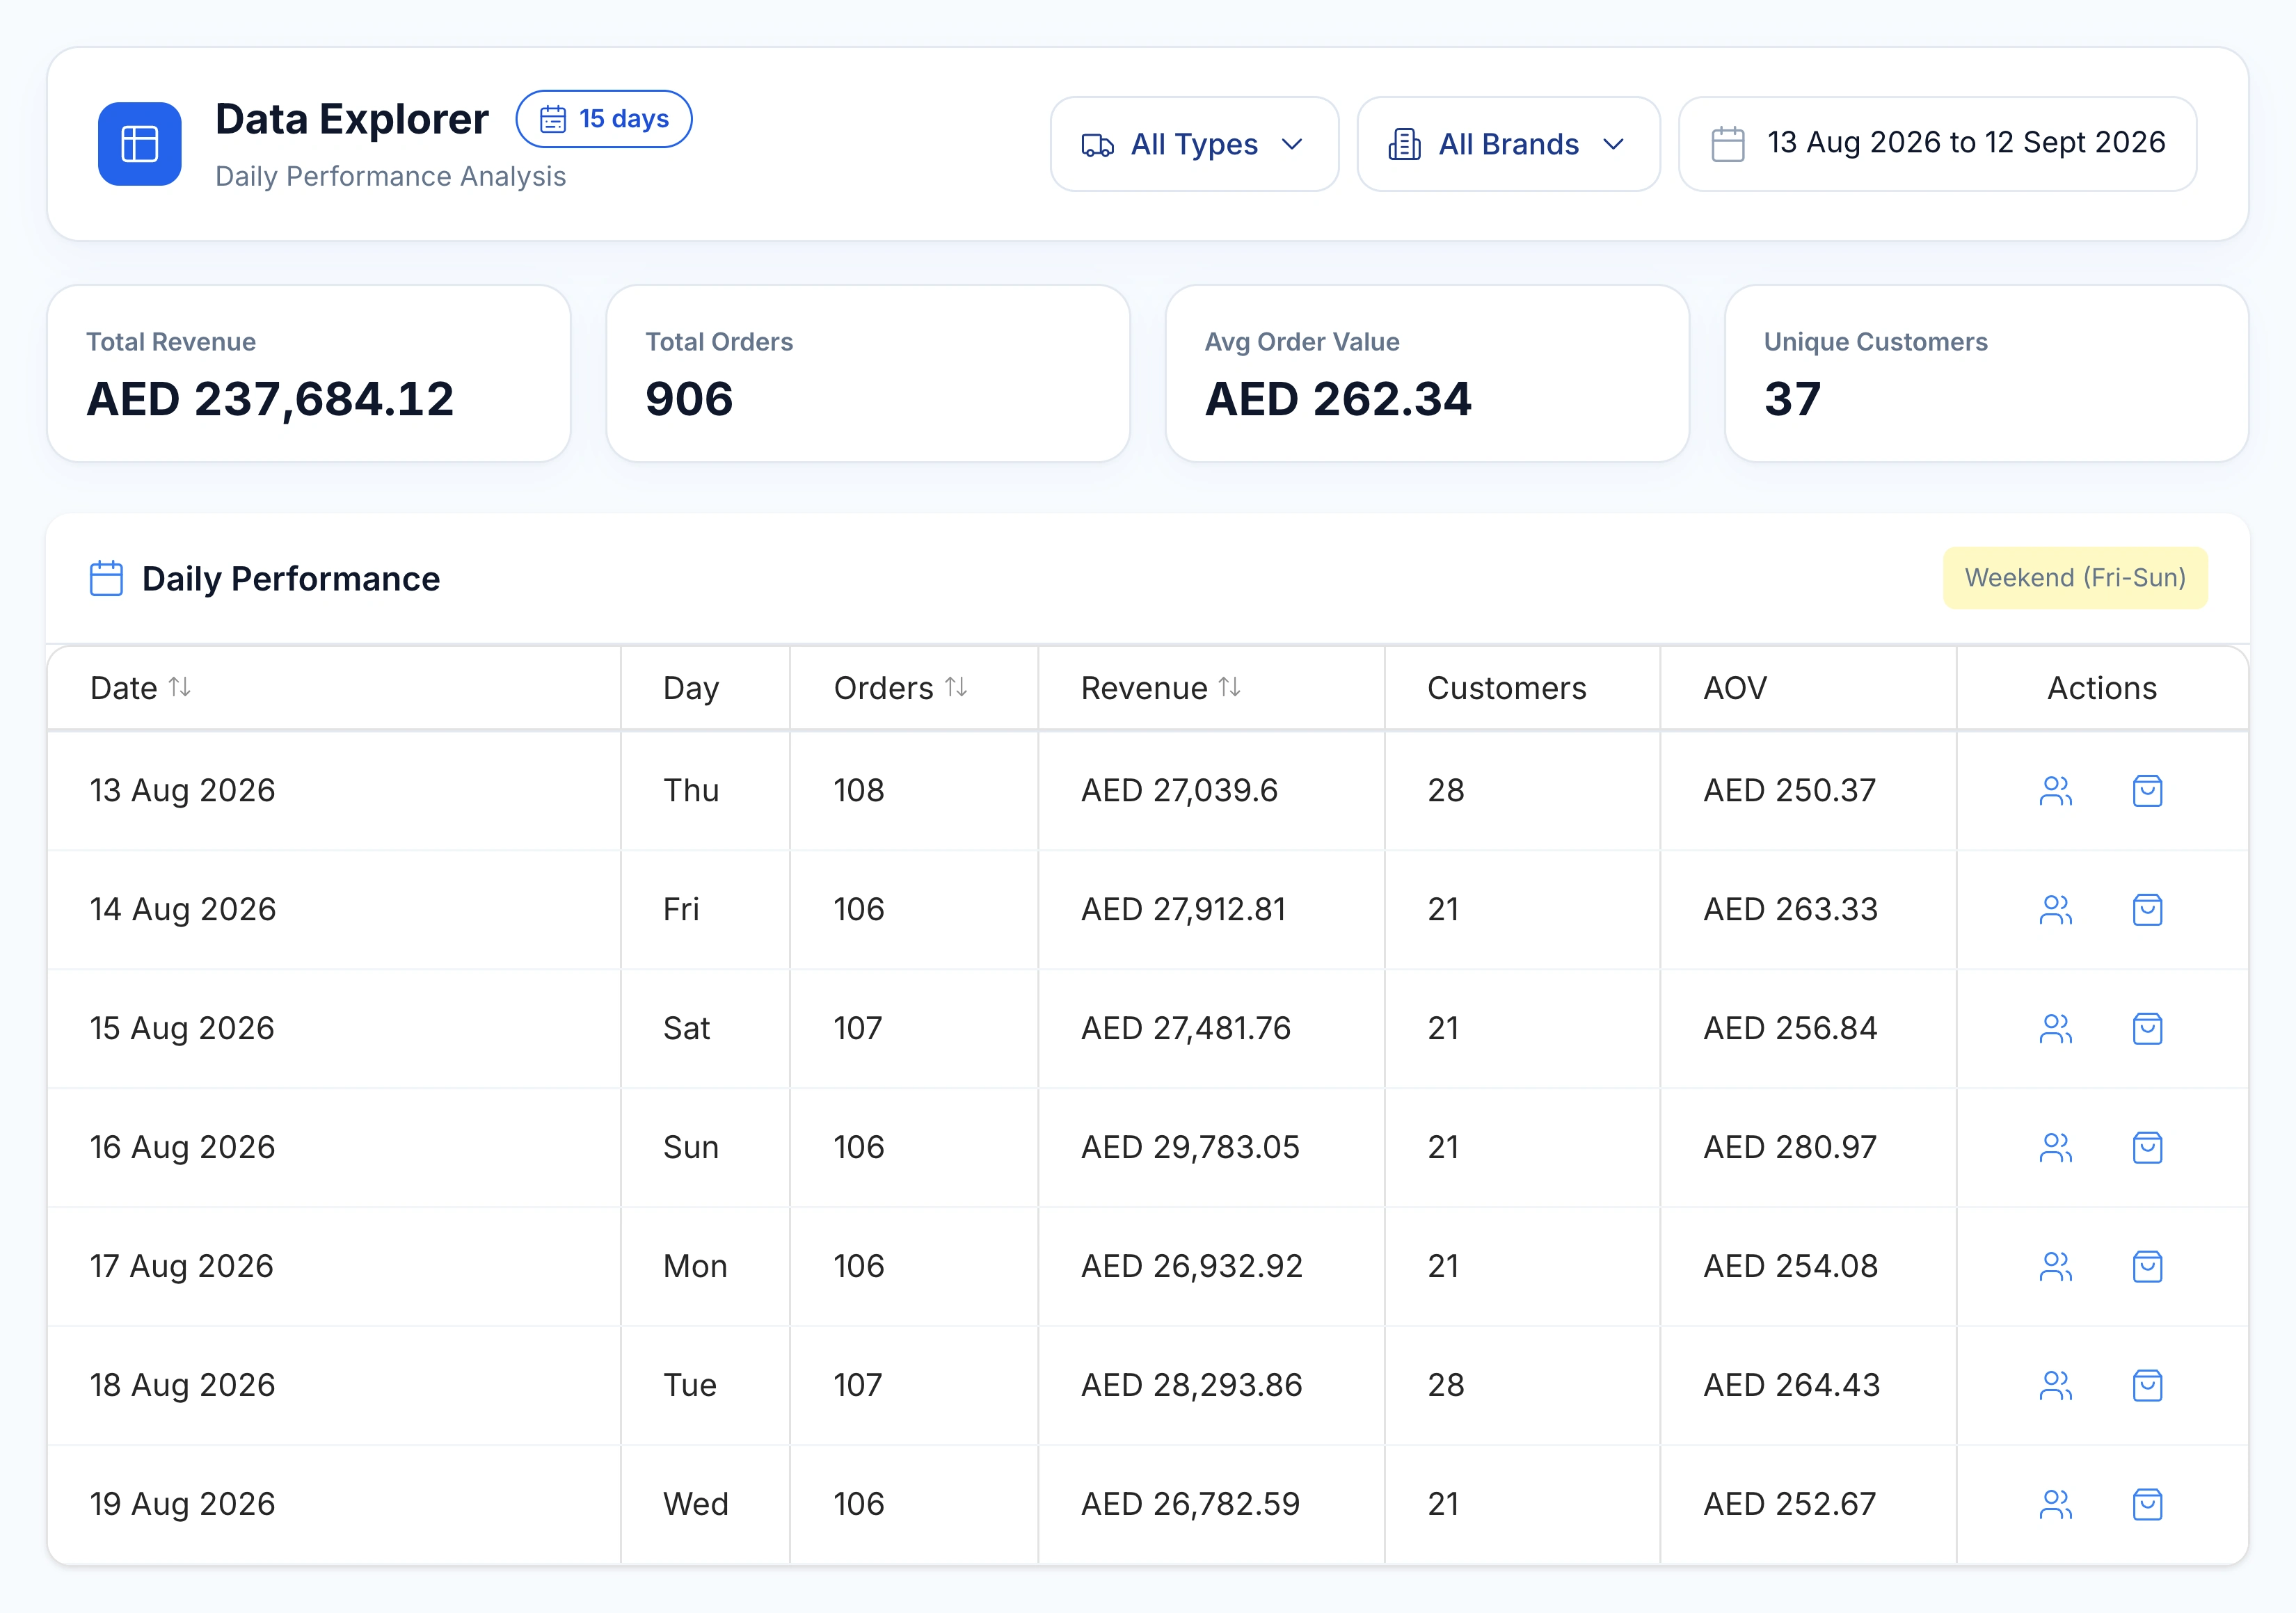
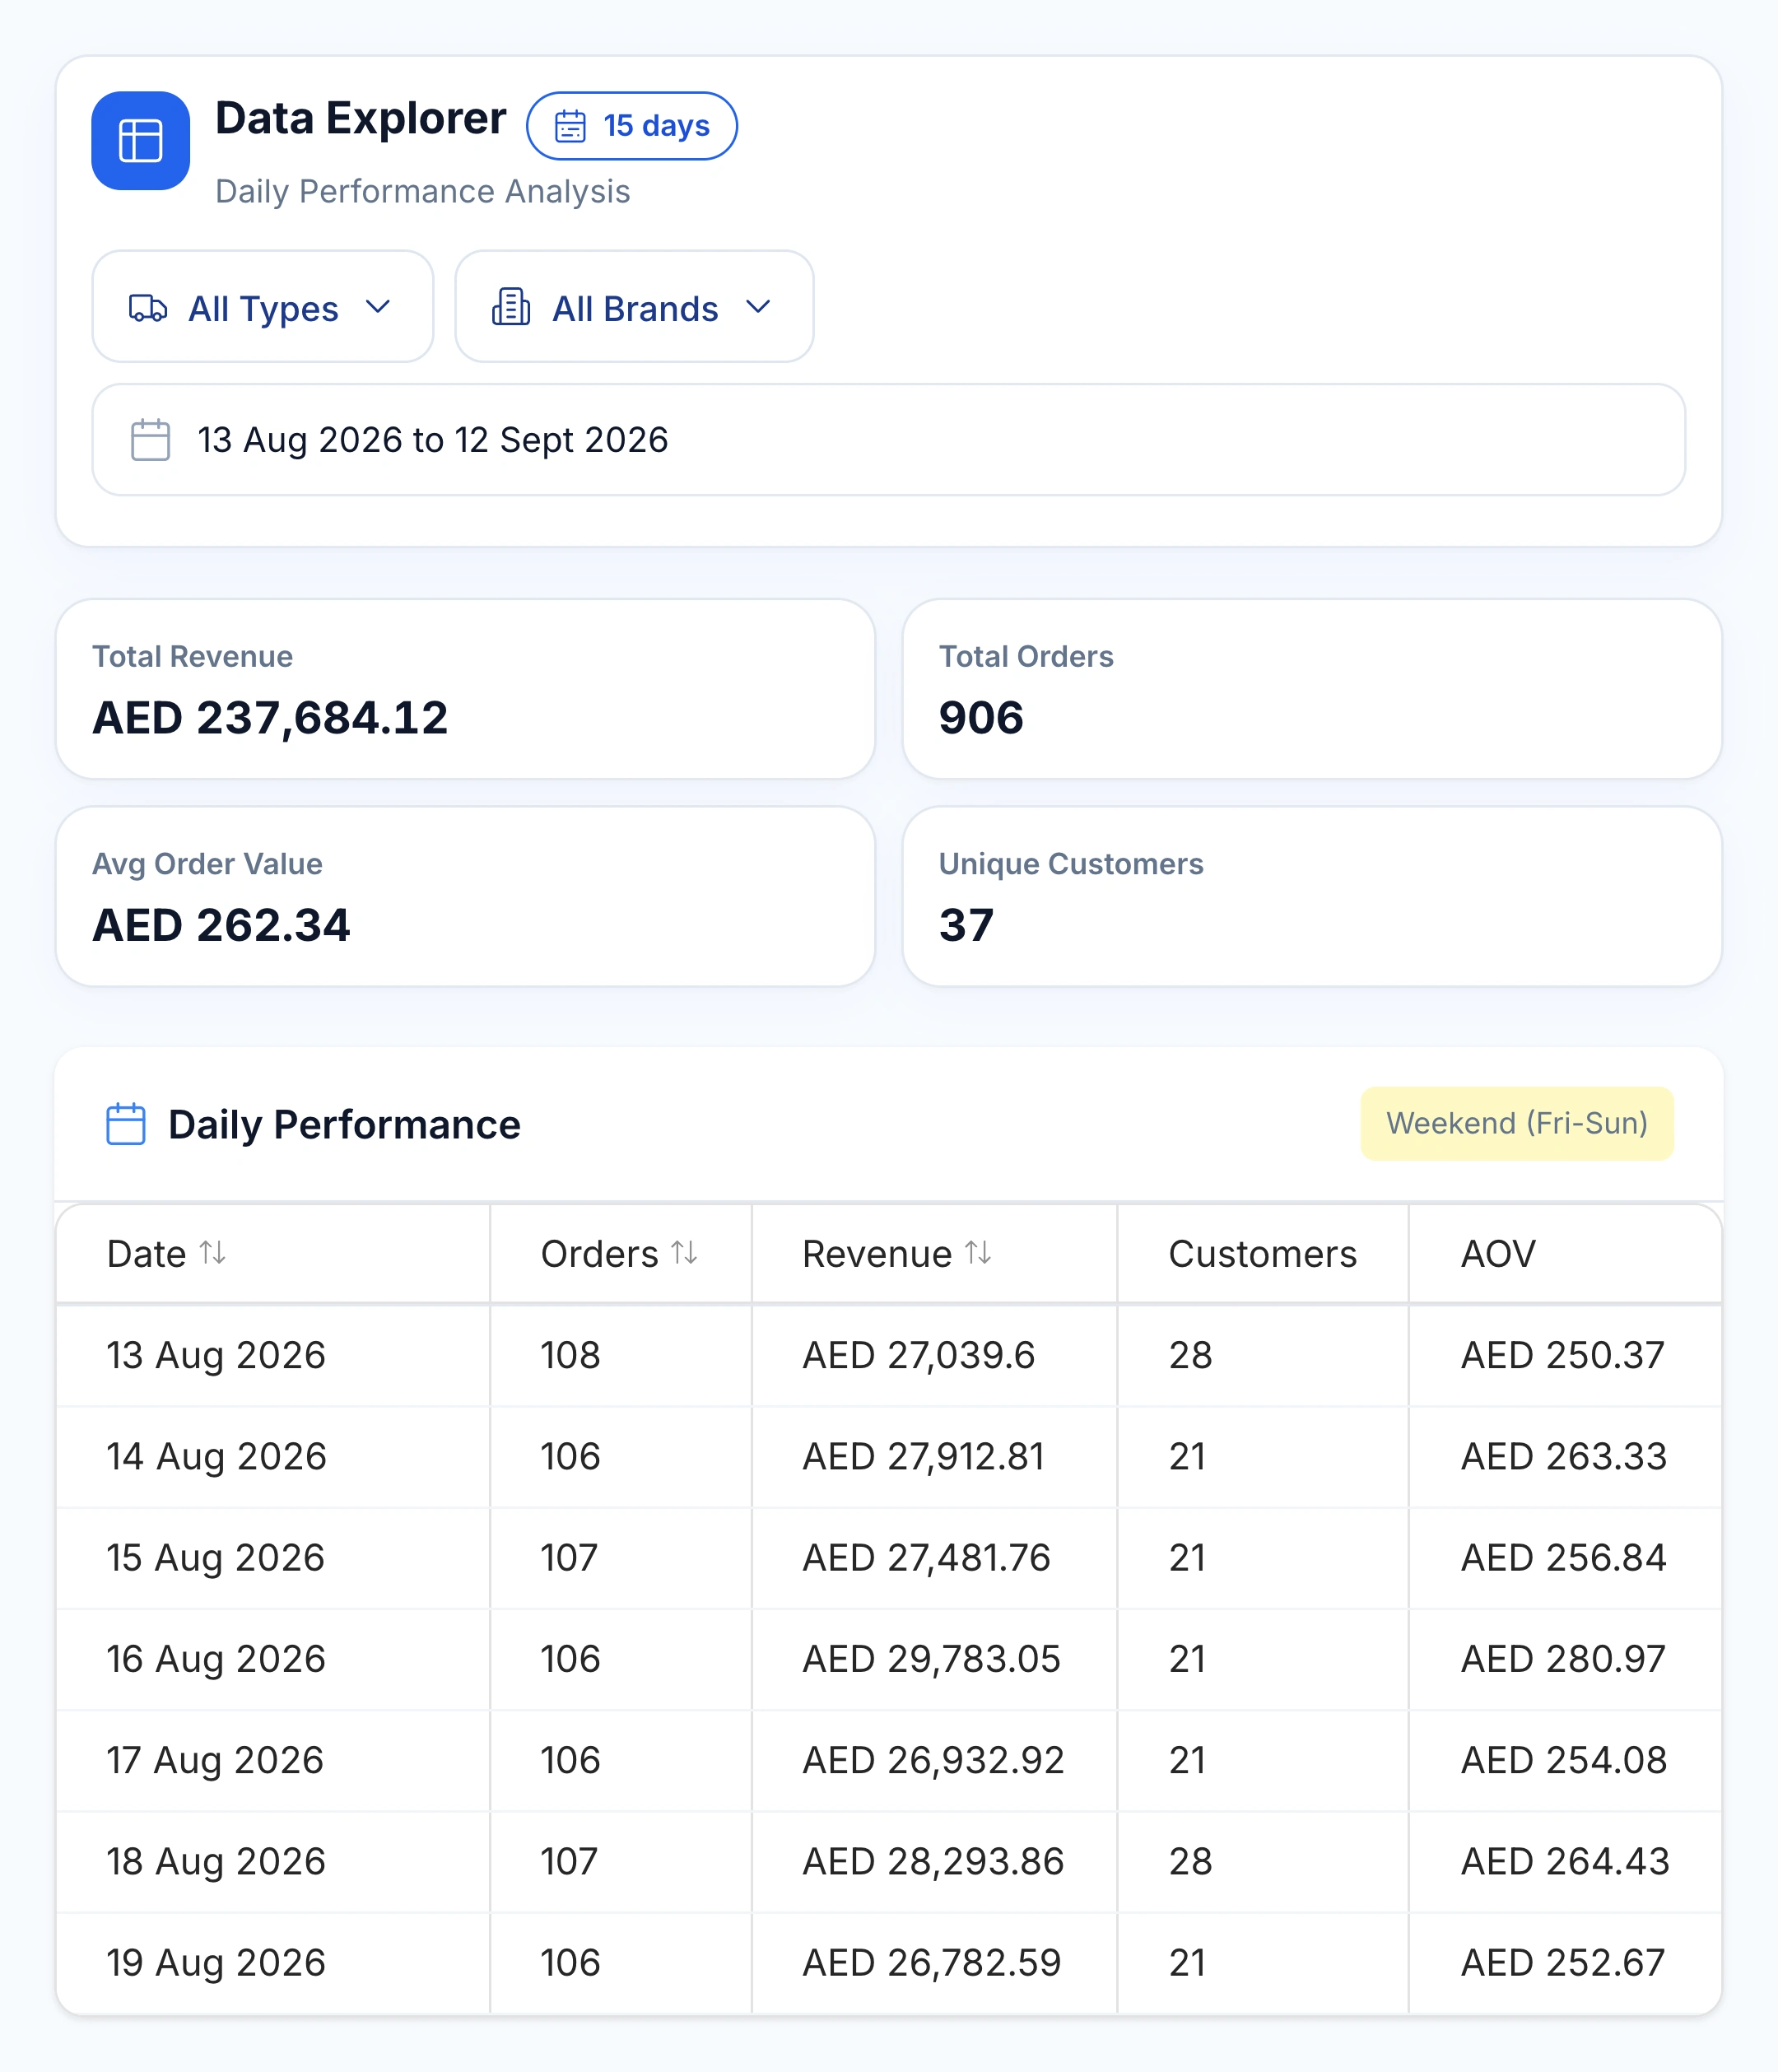
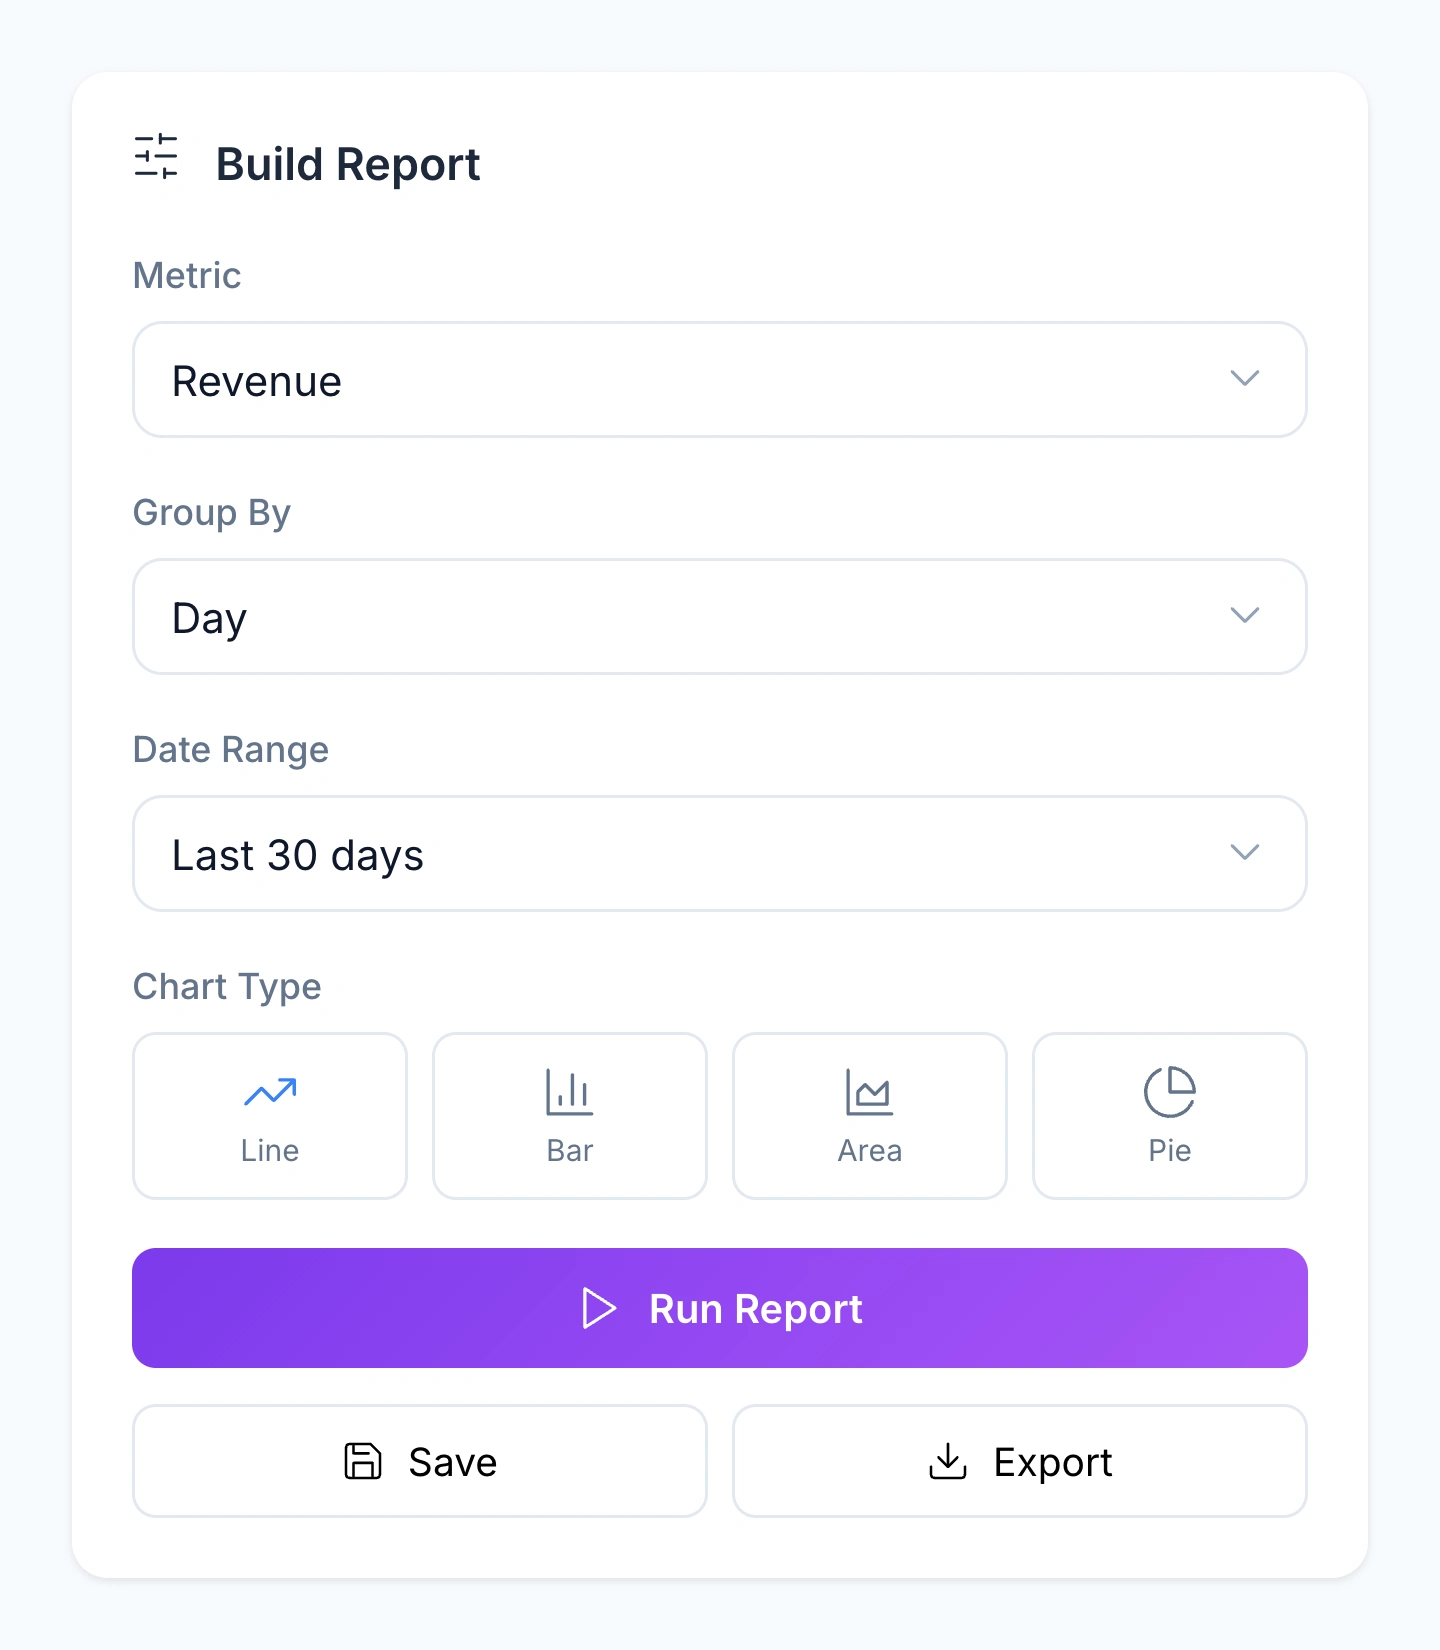
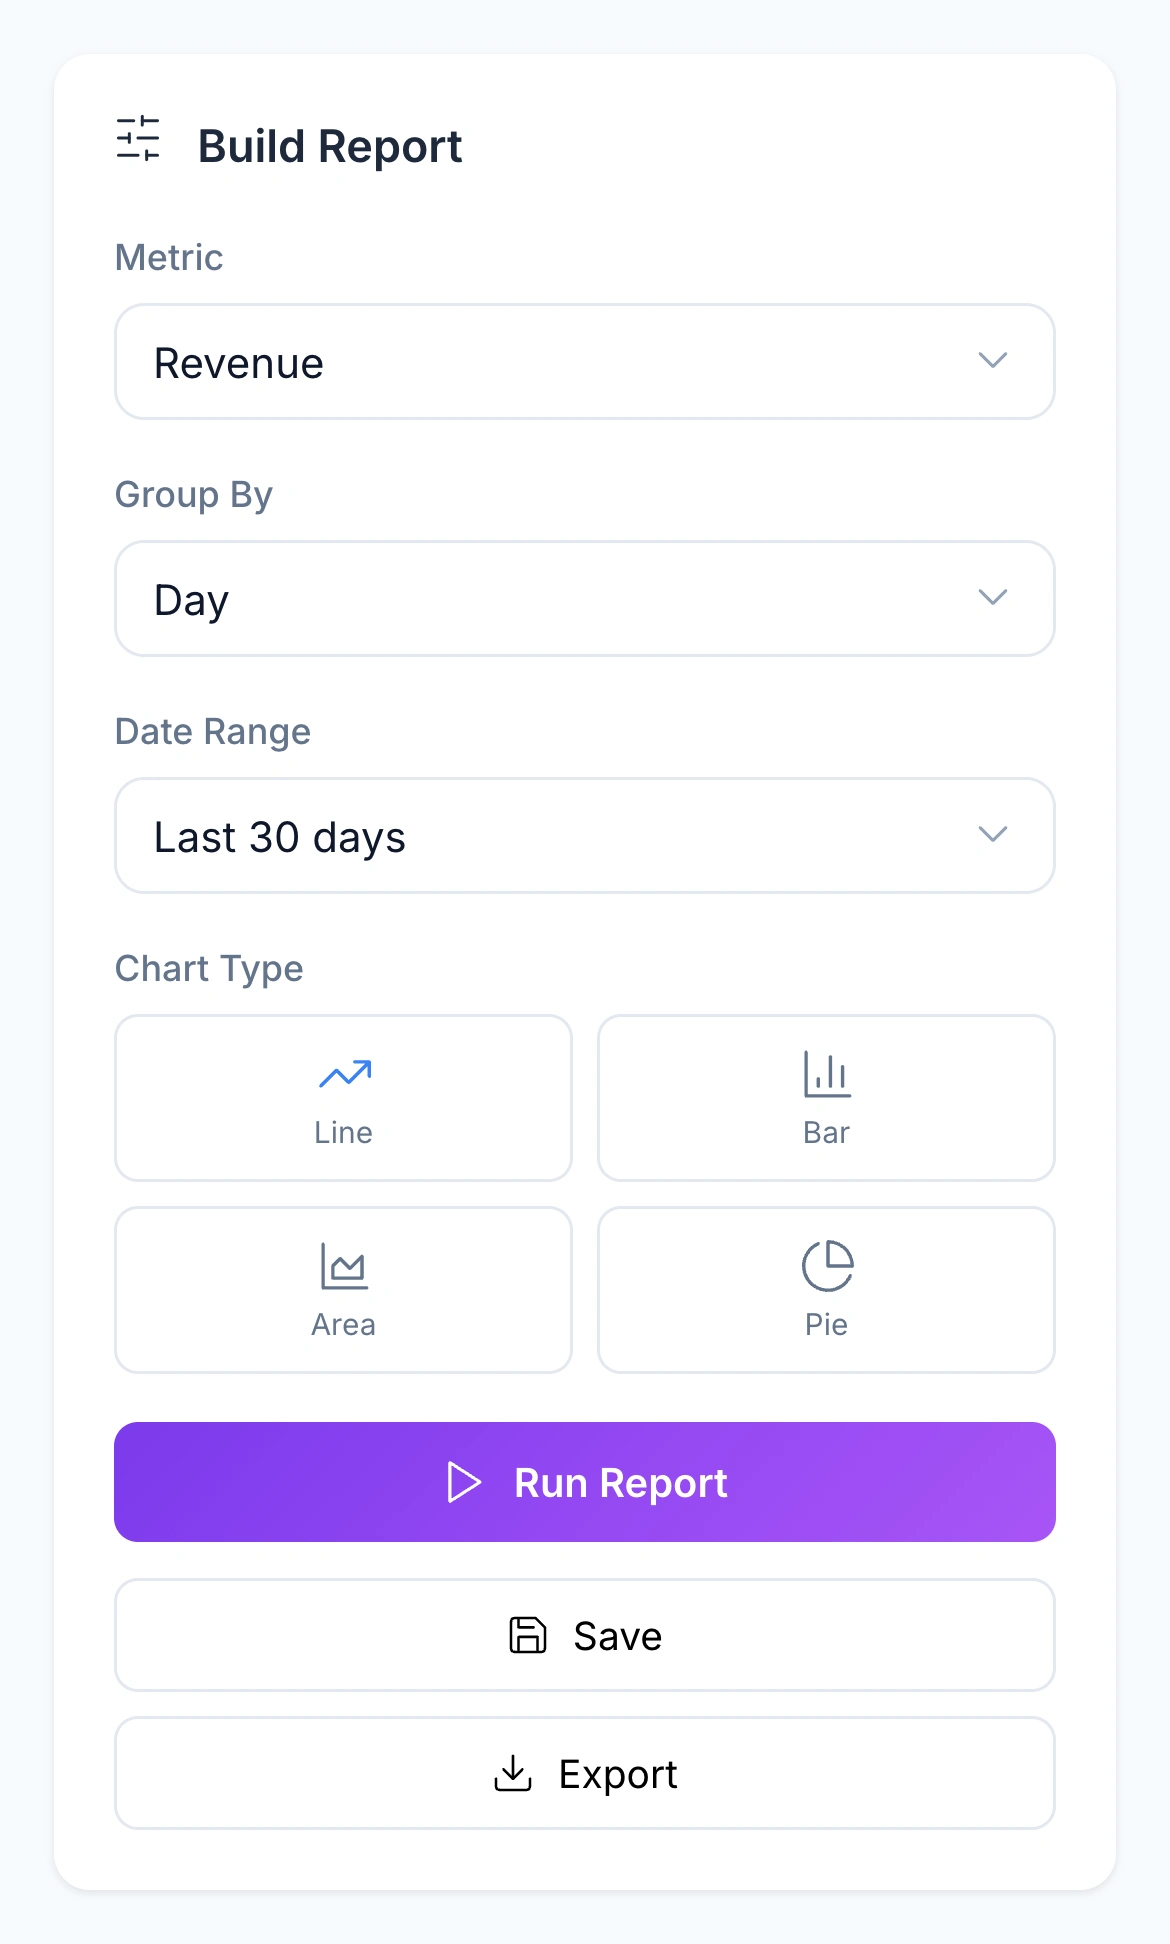
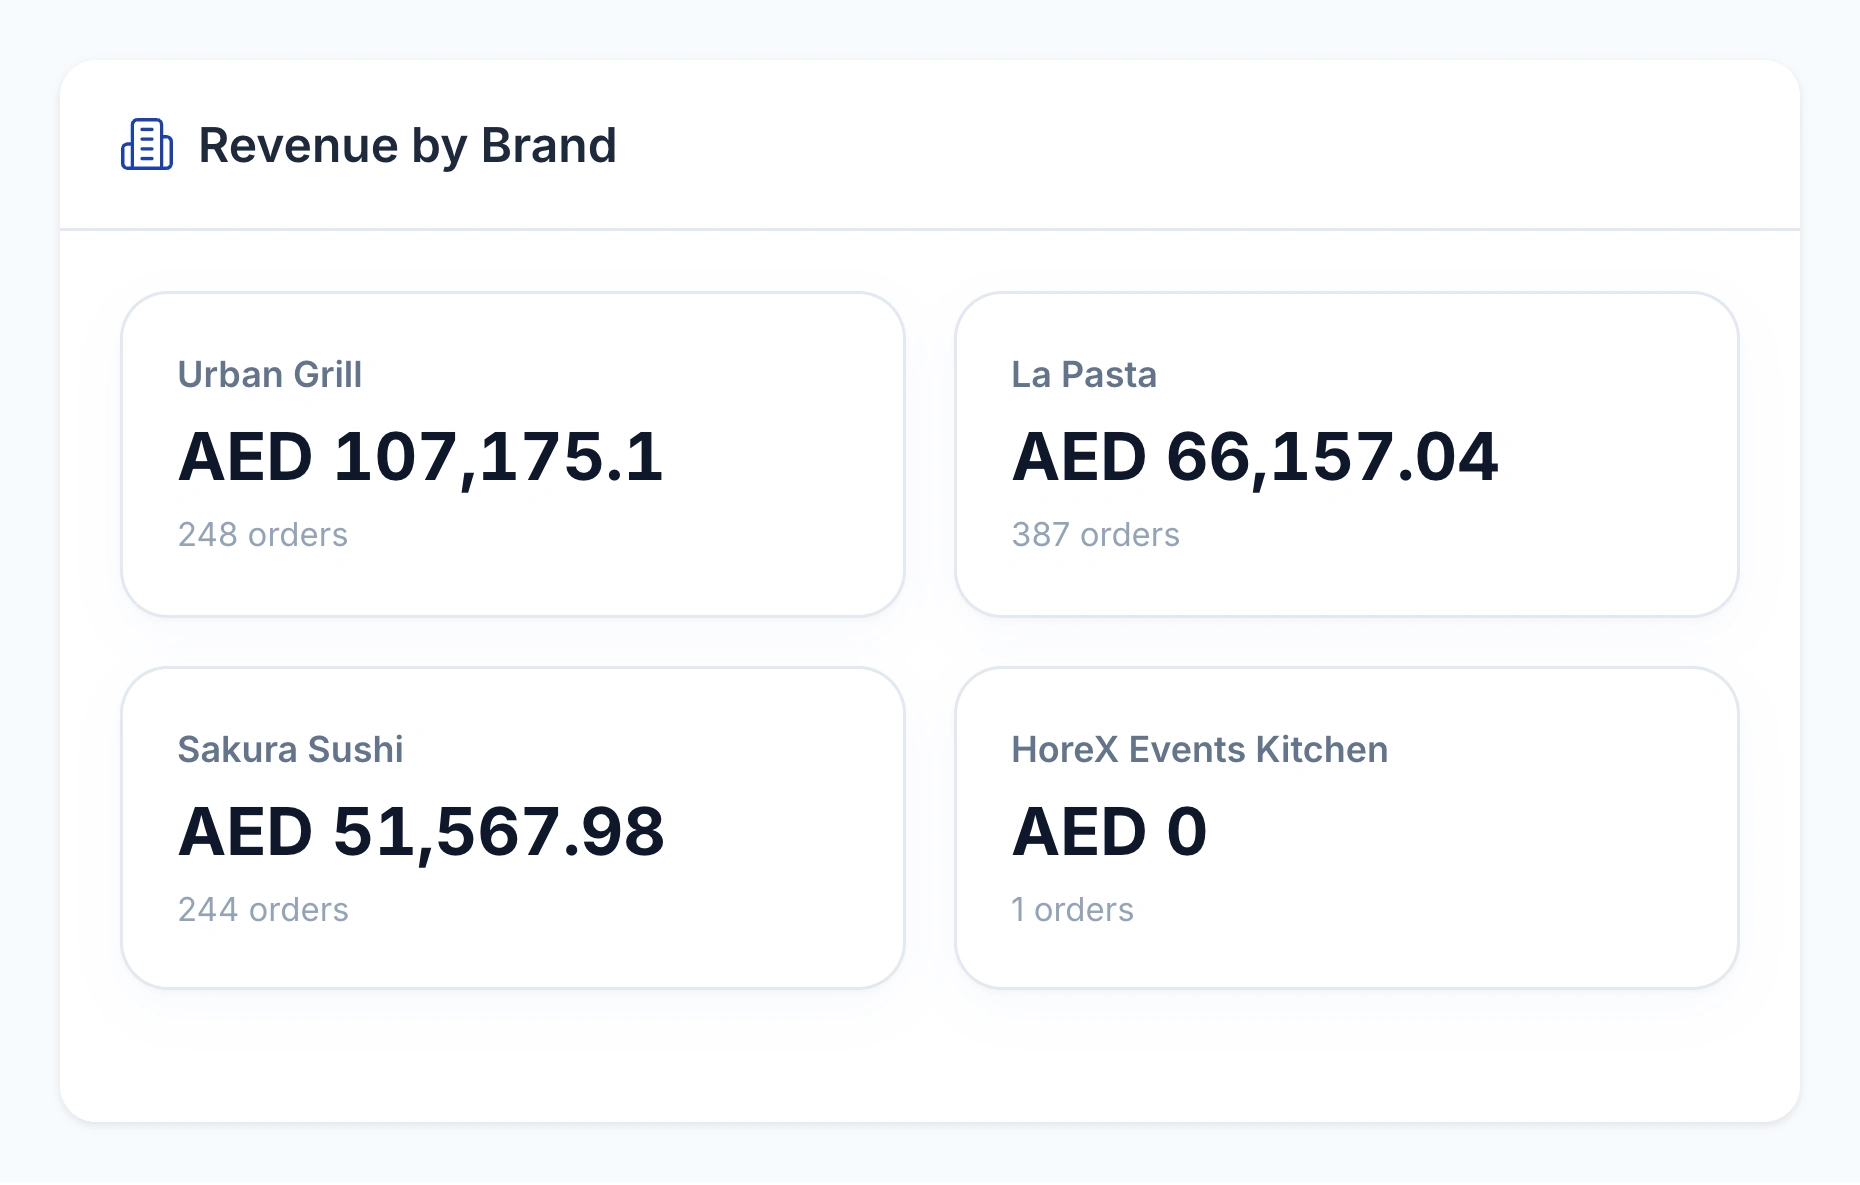
Build and save custom reports by choosing a metric, grouping, period and chart. Compare daily performance, order channels and brands, then open the customers or orders behind a day in Data Explorer.

Explore the orders

Data Explorer daily revenue, order and customer counts with links to underlying records
Example account
Data Explorer daily revenue, order and customer counts with links to underlying records
Example account

Report settings

Native Custom Reports controls for metric, grouping, date range, chart type, save and export

Compare brands

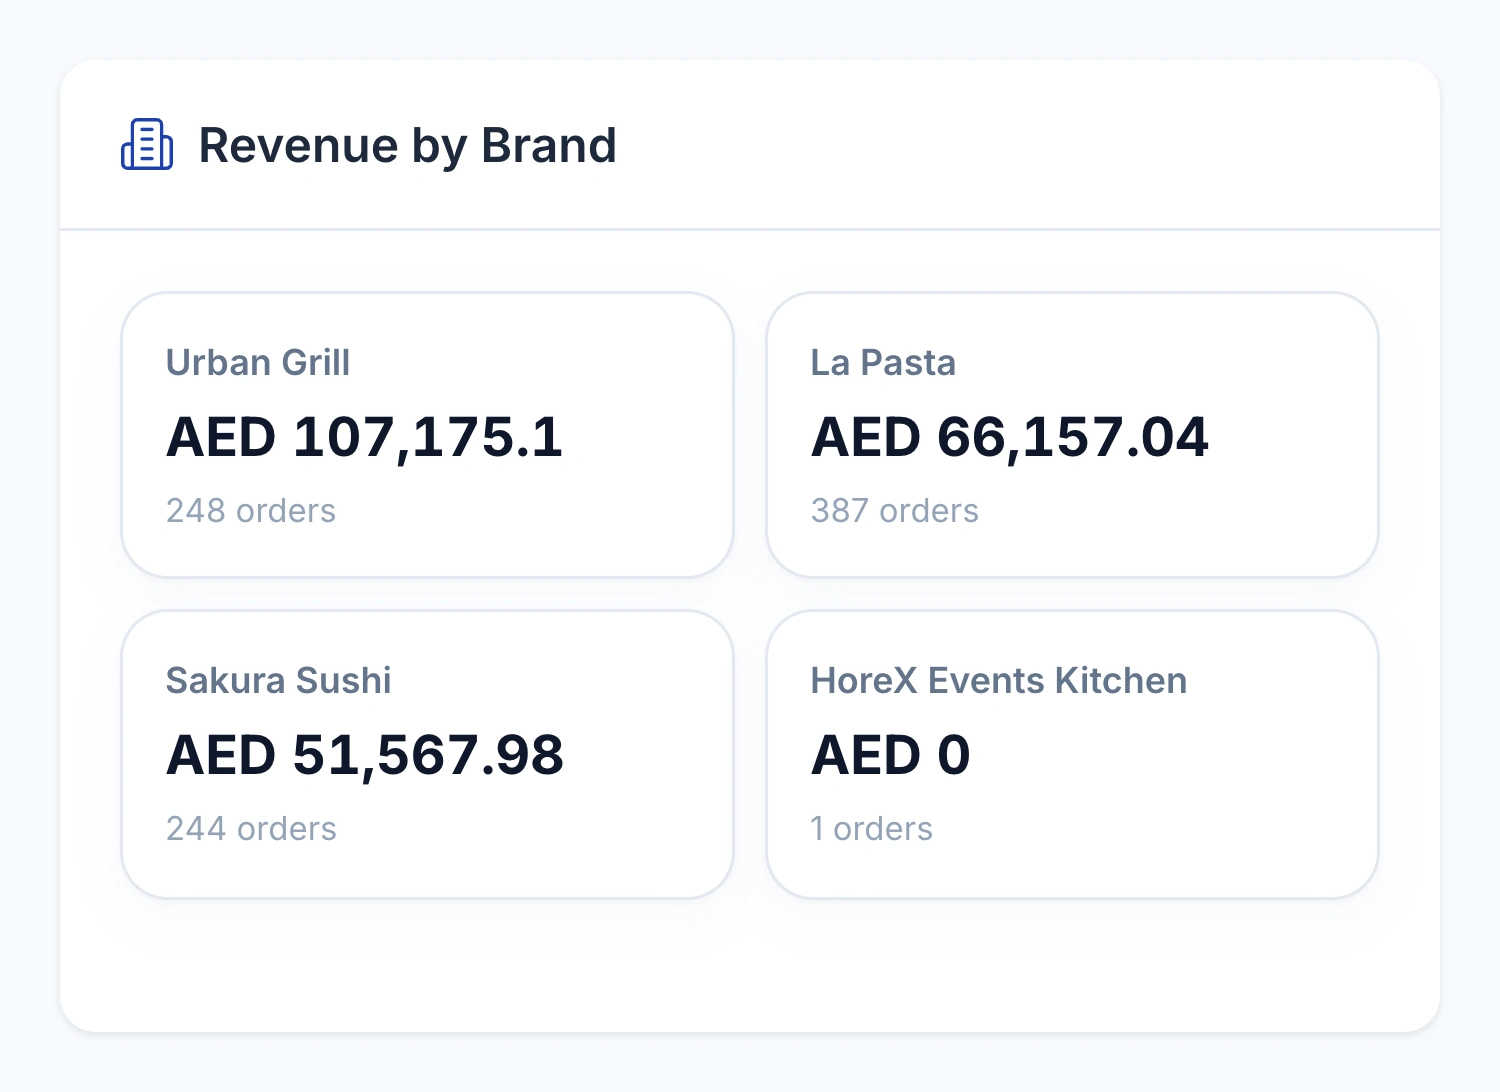
Native revenue-by-brand cards with order counts
Example account
Native revenue-by-brand cards with order counts
Example account

For a restaurant group, review which brand or branch sits behind the activity. Add connected ad spend and posted marketing costs to the organisation-wide view when discussing acquisition cost and the value of acquired customers.

  • Saved custom reports and chart types
  • Daily performance with order drill-down
  • Brand and branch context
  • CSV and spreadsheet exports

The detail your marketing team needs.

Attribution, advertising, local demand, customer behaviour and the tools to act on it.

Sales and guest overview

Start with orders, revenue and returning guests.

See details

Select the period and available business filters. The overview brings order totals, average order value and identified customer activity together, with definitions alongside the metrics.

  • Order and revenue totals
  • Average order value
  • Repeat-customer rate

Customer cohorts

Compare guests who first ordered in the same period.

See details

Group guests by acquisition period and follow their later orders, revenue or retention. Compare cohorts at the same age, and check the group size before drawing a conclusion.

  • Acquisition periods
  • Retention heatmap
  • Cohort size

Inactive guests

Find guests who have not ordered recently.

See details

Recency views use elapsed time since the last order, including 30, 60 and 90-day bands. Review the group and its history before deciding on a re-engagement offer.

  • Last-order recency
  • Inactive guest groups
  • Follow-up audiences

Tagged campaign links

Connect a tagged order to its recorded source.

See details

Use UTM-tagged links in your campaigns. When the tags reach the order, compare source, medium and campaign with recorded orders, customers and revenue. Untagged orders remain outside that attribution.

  • Source and medium
  • Campaign tags
  • Tagged-order revenue

Promo-code results

See the orders that used an offer.

See details

Review usage, order value, discounts and new or returning customers for a promo code. These are recorded results; they do not by themselves show how many orders would have happened without the offer.

  • Code usage
  • Discount totals
  • New and returning guests

Guest segments

Compare recency, frequency and spending together.

See details

RFM groups identified guests using their order history. Use the segments as a starting point for an audience, then check the individual customer details and the offer’s relevance.

  • Recency
  • Order frequency
  • Recorded spending

Items bought together

Look for common combinations in guest orders.

See details

Product analysis shows items that occur together, their counts and basket values. Use the observed combinations when reviewing menu placement or planning an offer.

  • Item pairs
  • Order counts
  • Basket values

Campaign results

Review delivery and orders for your outreach.

See details

Use the campaign workspace to follow message delivery, reads and linked results where available. Keep provider delivery metrics separate from tagged-order revenue when comparing campaigns.

  • Delivery status
  • Read rates
  • Linked order results

Identified dine-in guests

Include restaurant visits in guest history.

See details

A POS order associated with a guest contributes to that guest’s activity. Anonymous orders still count in sales totals but cannot establish a person’s repeat visits.

  • Guest-linked POS orders
  • Dine-in revenue
  • Repeat history

Marketing spend

Bring connected ad costs into the wider sales picture.

See details

The dashboard combines supported Meta and Google spend with posted marketing invoices. Its blended cost and return metrics use organisation-wide data; they are not a separate campaign’s causal return.

  • Connected ad spend
  • Posted marketing costs
  • Blended cost metrics

Data Explorer

Open the orders and customers behind daily performance.

See details

Compare daily order count, revenue, average order value and customer activity. Filter the period, brand and order type, then open the underlying records to investigate a result. Saved Custom Reports adds configurable metrics, grouping and charts.

  • Daily performance
  • Brand and order-type filters
  • Underlying customers and orders

Delivery-area analysis

See where delivery demand is concentrated.

See details

Customer Map groups delivery locations into areas for analysis. It helps compare demand by location without presenting a list of individual guest addresses on the map.

  • Delivery demand areas
  • Location filters
  • Aggregated view

Meta Ads management

Review campaigns, ad sets and creatives against orders.

See details

Connect Meta advertising data to campaign performance in HoreX. Inspect spend, clicks, CTR and CPC alongside UTM-attributed orders and revenue, drill into the campaign structure, and use the available budget and pause controls.

  • Campaign → ad set → creative
  • Spend and restaurant revenue
  • Budget and pause controls

Google Ads management

Bring Google campaign results into the same workspace.

See details

Compare Google campaign spend, clicks and conversion reporting with the restaurant orders carrying the matching campaign tags. Review Meta and Google together or switch to the individual platform view.

  • Google campaign performance
  • Cross-platform overview
  • Attributed order revenue

Local advertising

Choose the area, goal and budget for each campaign.

See details

Start a Google local campaign around your restaurant. Select an advertising centre and radius, choose direct orders or restaurant visits as the goal, and prepare the budget, search phrases and ad copy. Review the campaign before starting it.

  • Google map and radius
  • Separate campaign goals and budgets
  • Restaurant, brand and branch context

Google profiles & links

Connect discovery to ordering and reservations.

See details

Connect eligible Google Business Profiles to manage the restaurant presence and review profile interactions. Create branch-specific booking links with campaign tags. Google profile interactions and directions are reported separately from recorded restaurant orders.

  • Restaurant profile connections
  • Tagged booking and ordering links
  • Profile interaction reporting

Flexible audience builder

Choose guests by purchases, location and behaviour.

See details

Combine more than 45 available conditions from guest profiles, orders and loyalty activity. Conditions include brand, branch, items, categories, recency, spend, purchase frequency and trends. Use AND within groups and OR between groups, then preview the audience.

  • 45+ conditions
  • Combined condition groups
  • Dynamic audience membership

Audience ideas in plain language

Turn an audience brief into editable conditions.

See details

With HoreX Intelligence enabled, describe the group you want to reach and review the proposed audience conditions. The result is a draft you can change before saving or using it in a campaign.

  • Plain-language audience brief
  • Editable condition draft
  • Requires HoreX Intelligence

Ready-made return scenarios

Act on birthdays, repeat visits and inactivity.

See details

Connect customer insight to loyalty automation templates. Set the qualifying event, timing, benefit and message for a birthday, visit milestone or win-back invitation. Your programme rules determine eligibility and redemption.

  • Birthday and milestone journeys
  • Adjustable inactivity triggers
  • Your benefit, timing and message

Saved custom reports

Keep the views your team uses each week.

See details

Choose the report metric, grouping, date range and chart type. Run the report, save a useful configuration and export the available data for further analysis. Data Explorer provides daily performance with access to its underlying customer and order records.

  • Metrics and groupings
  • Line, bar, area and pie charts
  • Saved views and exports

Brands & branches

Understand which restaurant sits behind the result.

See details

Filter supported reports and audience conditions by brand or branch. A guest can buy from more than one of your restaurants, and identified purchase history retains that context. Organisation-wide marketing costs stay distinct from branch-level revenue.

  • Multi-brand customer activity
  • Branch-specific audiences
  • Relevant business filters

Questions about Marketing Analytics

What is end-to-end analytics for restaurants?

It connects restaurant order records, identified guest activity and supported campaign sources. You can review sales, repeat visits, tagged links and marketing costs with the underlying definitions in view.

How does HoreX track offline restaurant visits?

When staff link a POS order to a guest, that visit becomes part of the guest’s history. Anonymous orders remain in sales totals but cannot identify a returning person.

Can I see which campaign or channel actually brought a guest?

You can see the source, medium or campaign recorded with a tagged order, and review promo-code usage. This records available attribution; it does not establish every earlier touchpoint or prove the campaign caused the visit.

What is RFM segmentation for restaurants?

RFM means recency, frequency and monetary value: when a guest last ordered, how often they order and what they have spent. HoreX uses this history to group identified guests for further review and audience selection.

Do I need separate BI tools or analytics platforms?

HoreX includes dashboards, cohorts, guest segments and Data Explorer. Teams can use the built-in reports for common questions and export supported data when a separate analysis is needed.

How is this different from Google Analytics for my restaurant website?

Website analytics describes website activity. HoreX adds recorded restaurant orders, identified guest history, dine-in sales and programme activity. Campaign tags connect supported online sources to orders when those tags are present.

Can I export analytics data?

Yes. Supported reports and customer analyses provide exports such as CSV or spreadsheets. Keep the filters and date range with the exported figures so the team compares the same scope.

How quickly does analytics data update?

Reports use the records available when the view is loaded or refreshed. Order activity, posted cost documents and connected ad accounts can arrive on different schedules, so check the period and last available source data.

Can I manage Meta and Google Ads from HoreX?

Yes. Ads Command Center brings connected Meta and Google campaign reporting into one workspace. Meta campaigns can be explored through ad sets and creatives, with budget and pause controls. Setup and available actions depend on the connected account permissions.

What does geo marketing include?

Customer Map groups delivery locations to show demand by area, with filters for order value, spending and repeat behaviour. Geo Marketing also supports local Google campaigns with an advertising centre, radius, goal and budget, connected restaurant profiles and tagged booking links. Campaign activation and profile features depend on the relevant Google account and approvals.

Why can platform ROAS and HoreX ROAS differ?

Ad platforms apply their own conversion reporting. HoreX order-based ROAS compares campaign spend with order revenue matched through the available campaign tags. Both views are useful, but they measure different records. Untagged orders are not automatically assigned to a campaign.

Can I turn a segment into a customer campaign?

Yes. Build an audience using order history, spending, dishes, brand, branch, recency and other conditions, then use it in a supported campaign channel. Ready-made loyalty journeys also respond to birthdays, visit milestones and inactivity. Review the audience, channel and offer before activation.

How are acquisition cost and customer lifetime value calculated?

Campaign reporting uses its attributed orders and customers. The blended acquisition-cost view combines organisation-wide connected ad spend and eligible posted marketing costs, divided by new identified customers. Cohort LTV is recorded revenue per acquired customer, not profit or a forecast. Check the selected period and customer group when comparing results.

See your marketing questions answered in HoreX.

Explore campaign attribution, local demand and returning guests with your restaurant’s marketing team.