



Reports & analytics for restaurants.

Build custom reports across sales, purchasing, stock, kitchen, people, finance and guests. Start from a ready-made template, investigate the detail and save the views your team uses every week.

01 / BUILD

Custom reports

Choose sources, dimensions, metrics and filters for your own analysis.

02 / REUSE

Templates & saved reports

Start with a restaurant template. Keep your own settings for the next review.

03 / UNDERSTAND

Compare & investigate

See changes over time and open the orders behind a result.

04 / MENU

Menu performance

Compare what sells with each dish’s cost and contribution.

05 / SERVICE

Shift reports

Check the day’s orders, payments and handover.

06 / COST CONTROL

Stock & cost analysis

Find the effect of prices, quantities and stock differences.

Explore all features

01 / CUSTOM ANALYTICS

Build the report around your question.

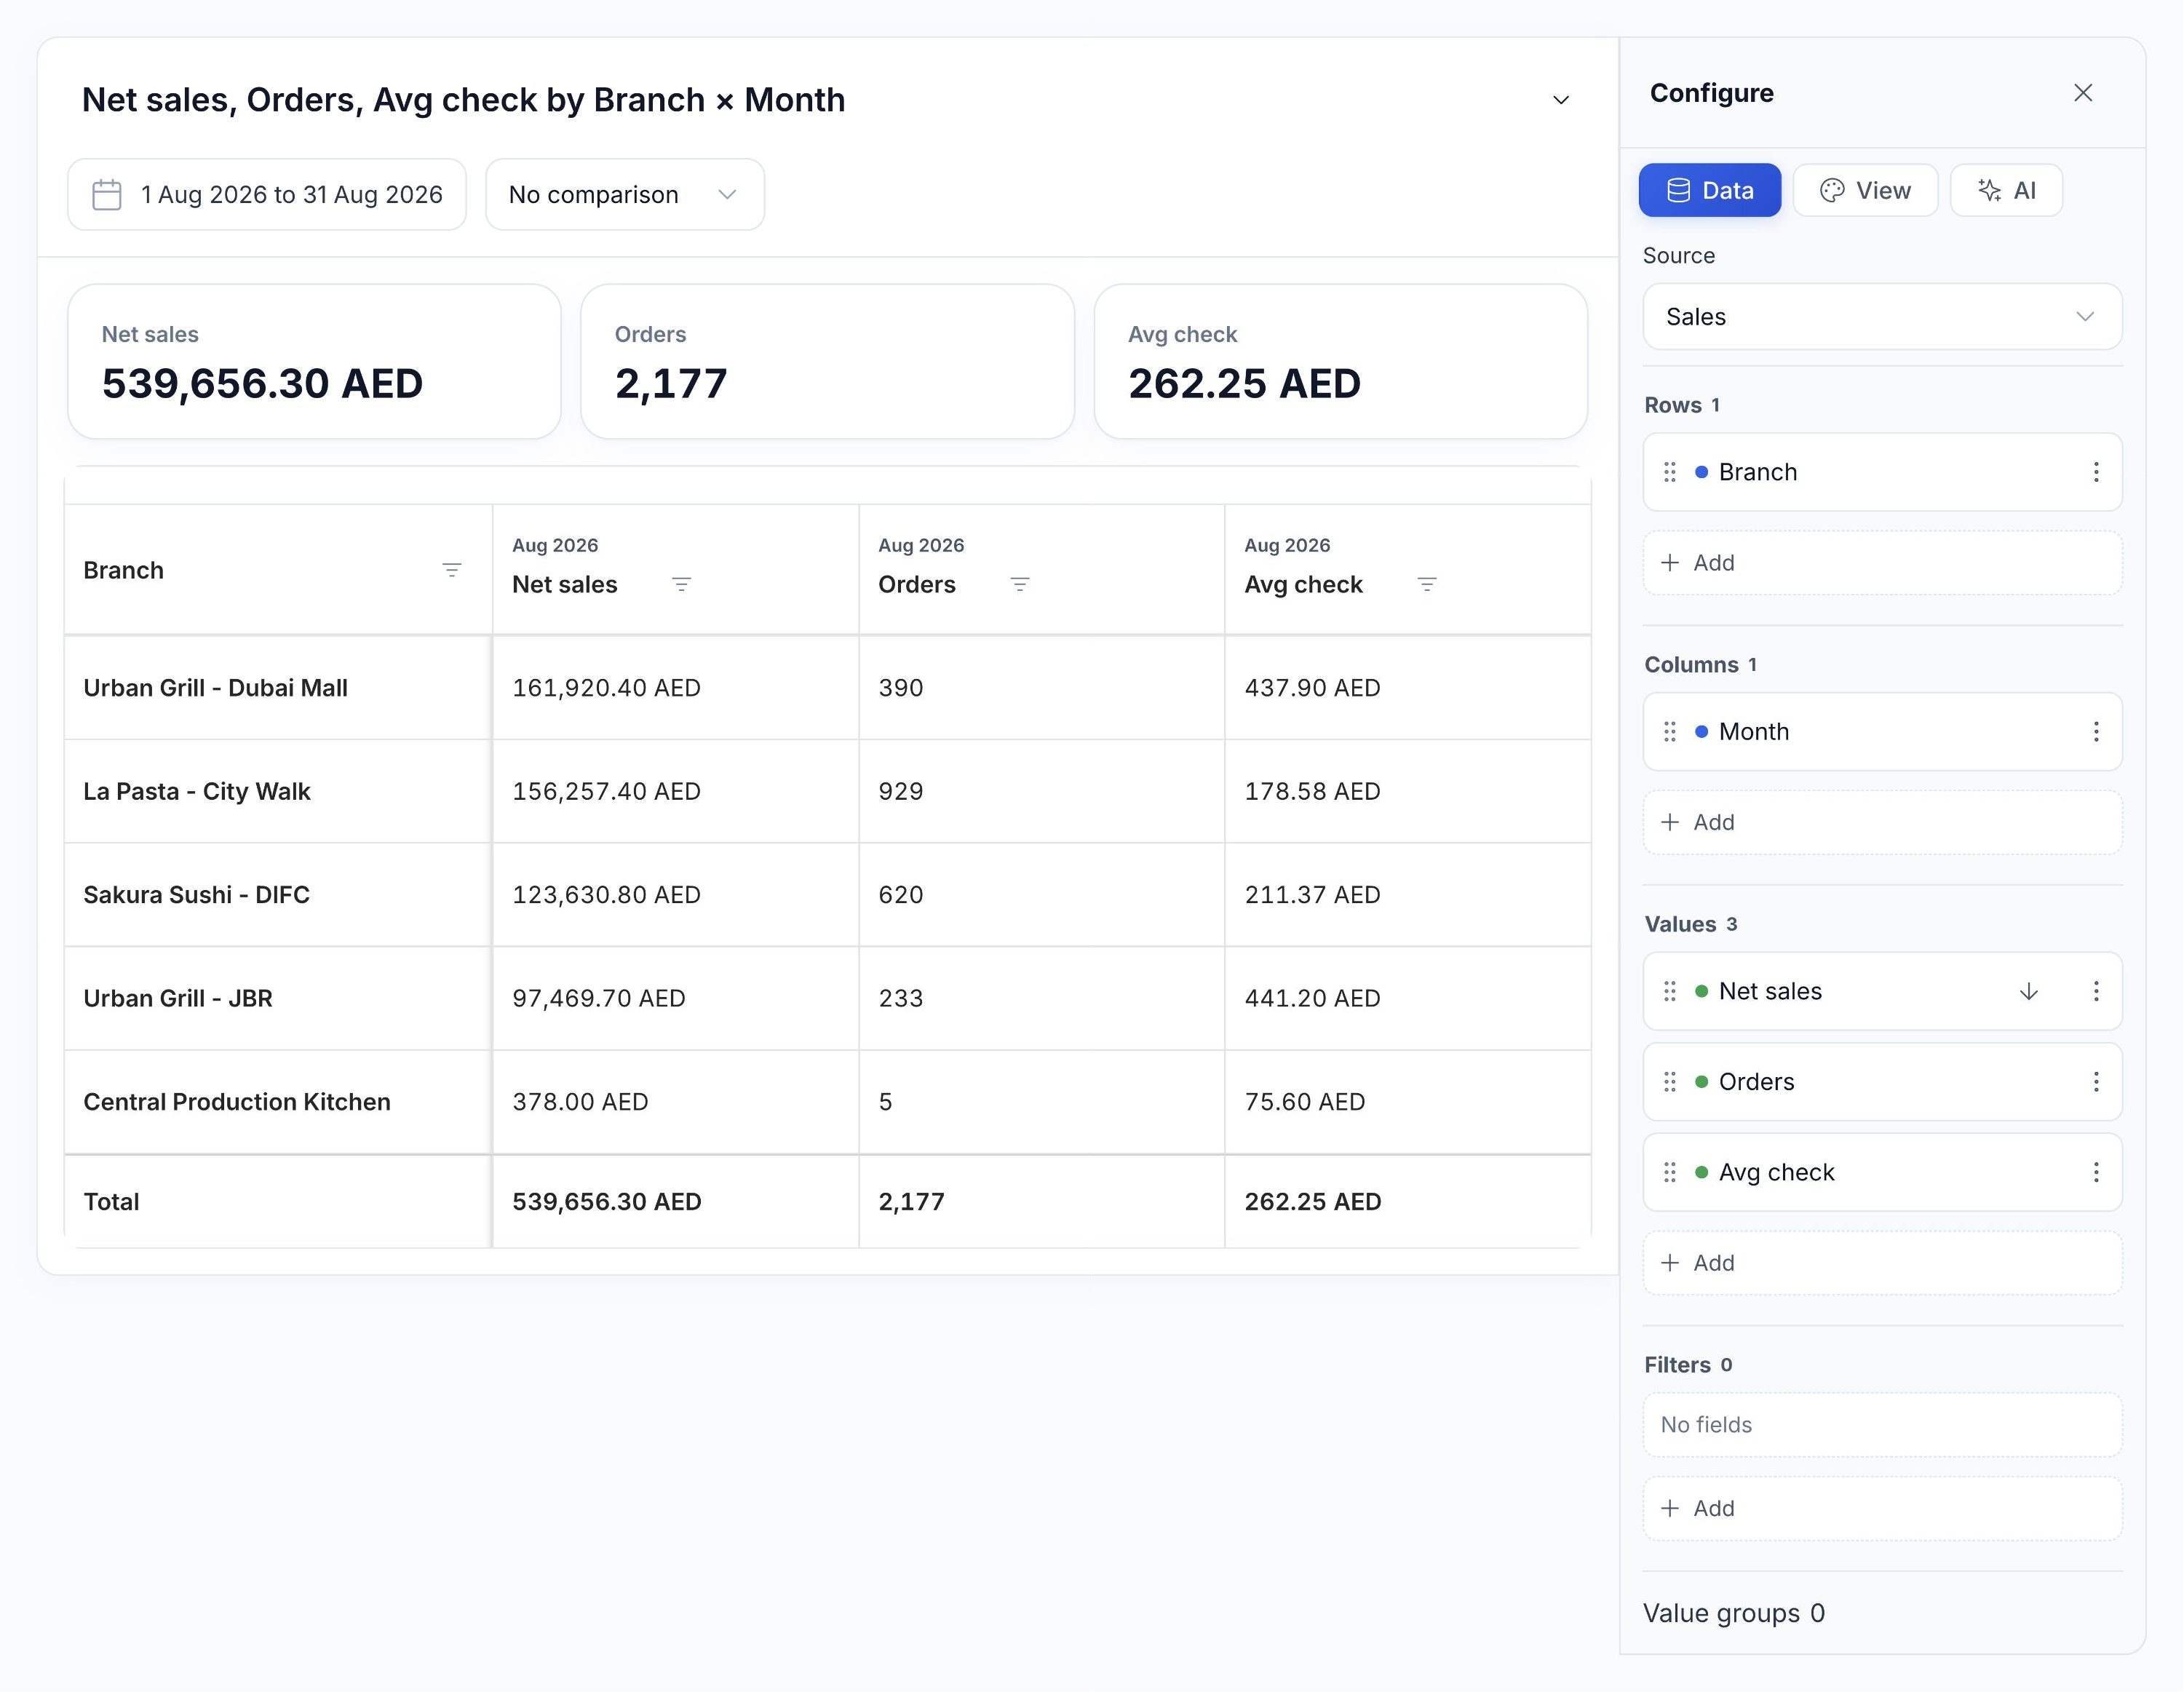
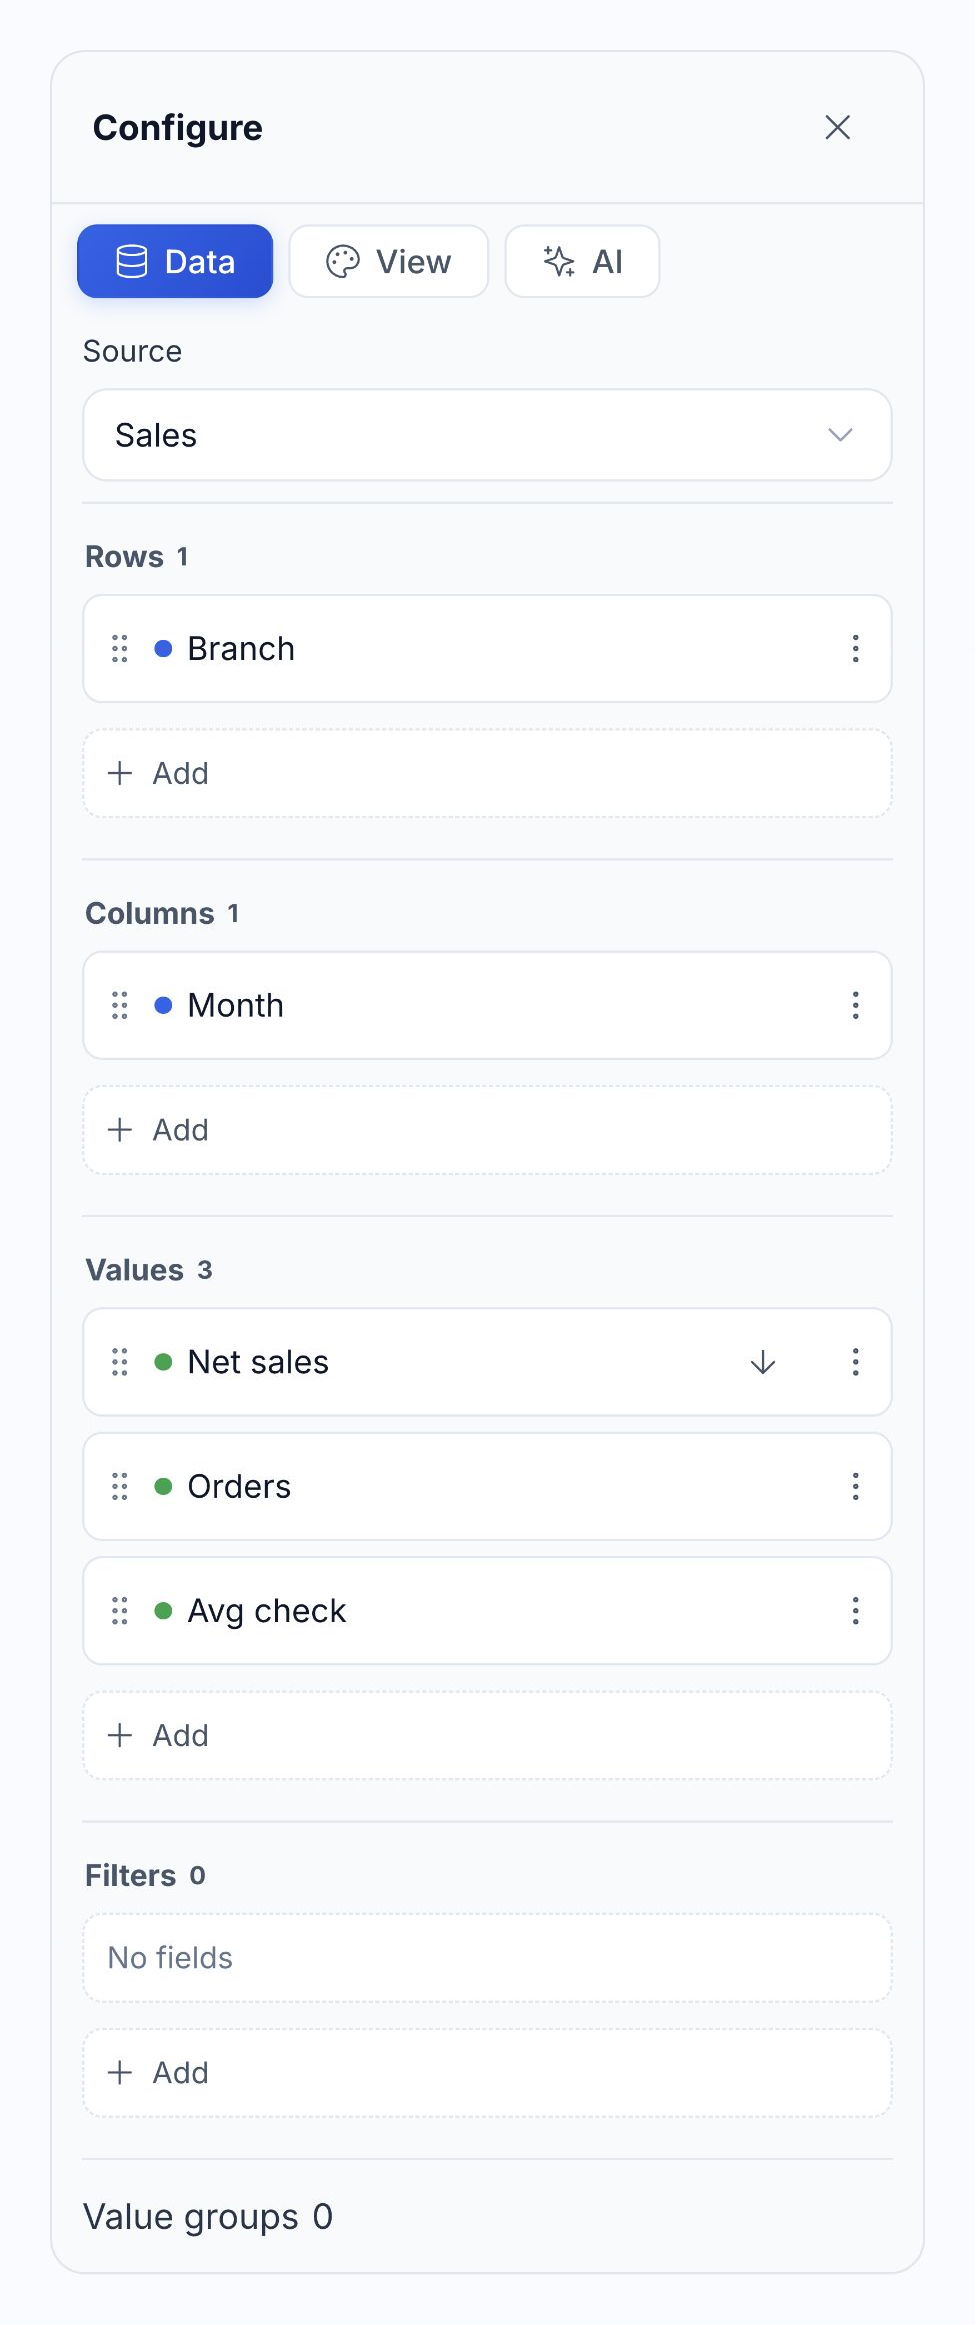
Choose a data source, then arrange the rows, columns and measures you want to compare. Review revenue by branch and month, purchase prices by supplier, or labor cost alongside attendance. Add filters and your own value groups to match how you run the business.

Configure

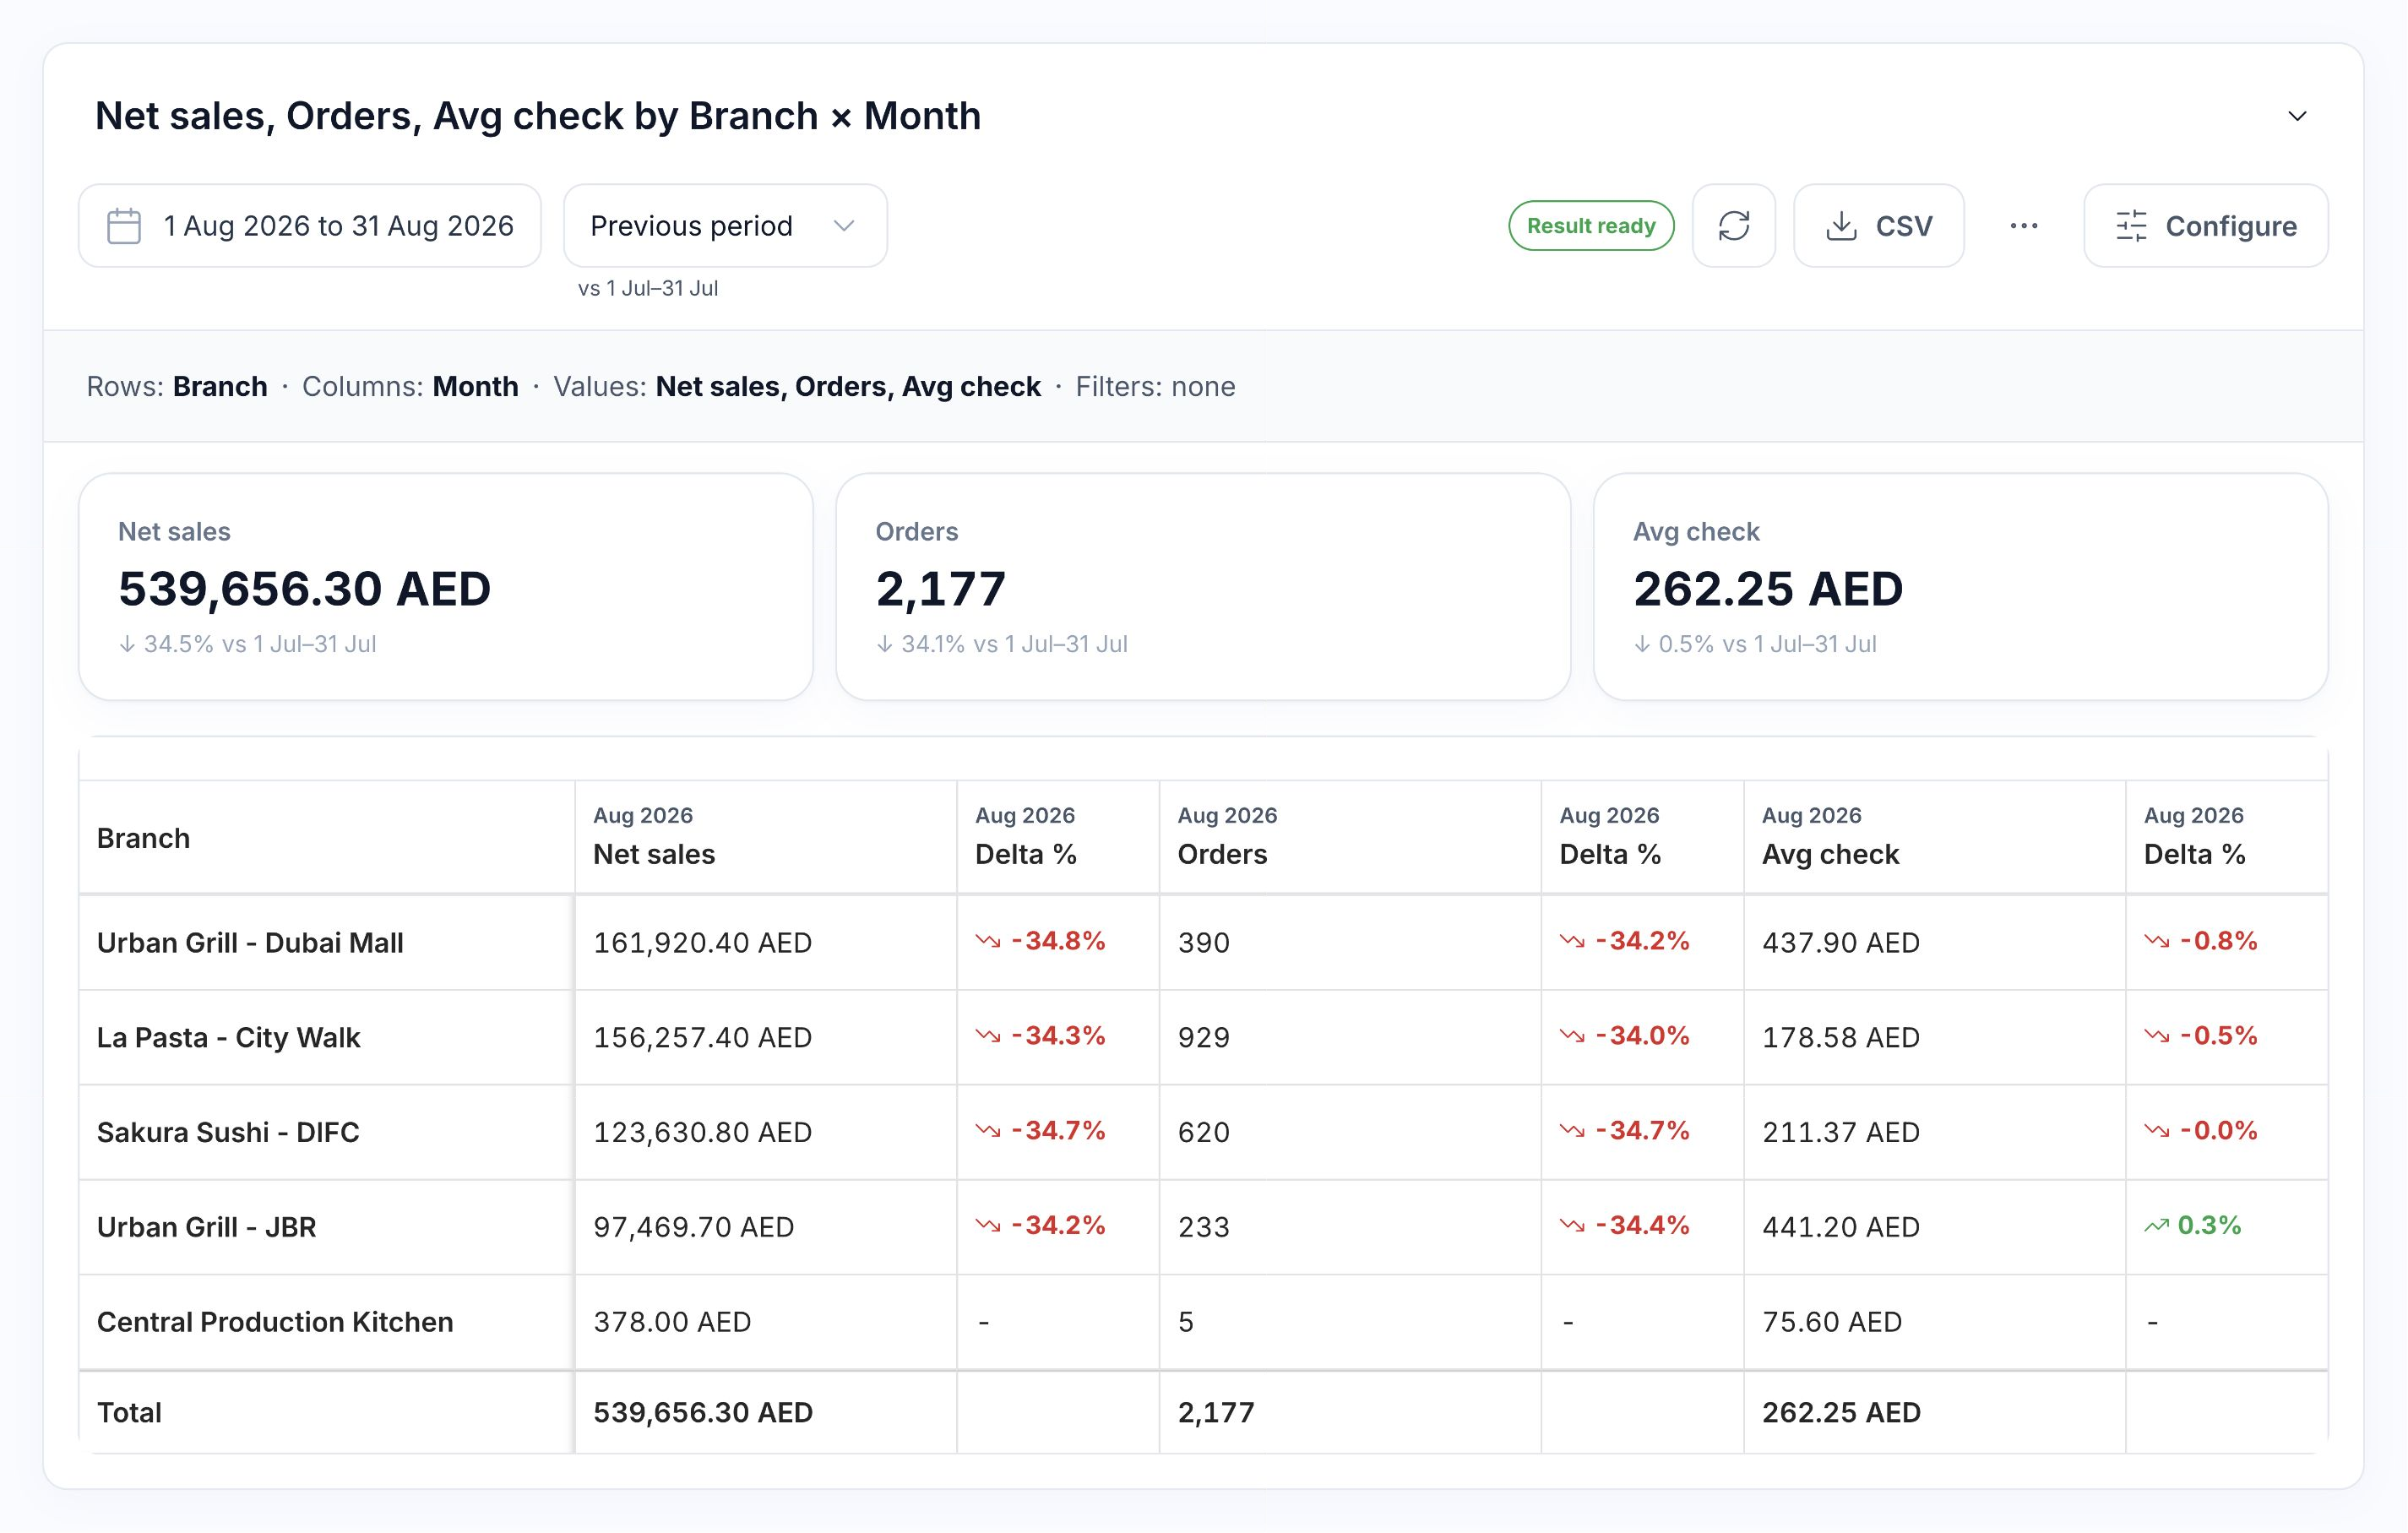
Native HoreX Analytics Builder with branch and month grouping, three measures and the resulting August sales report

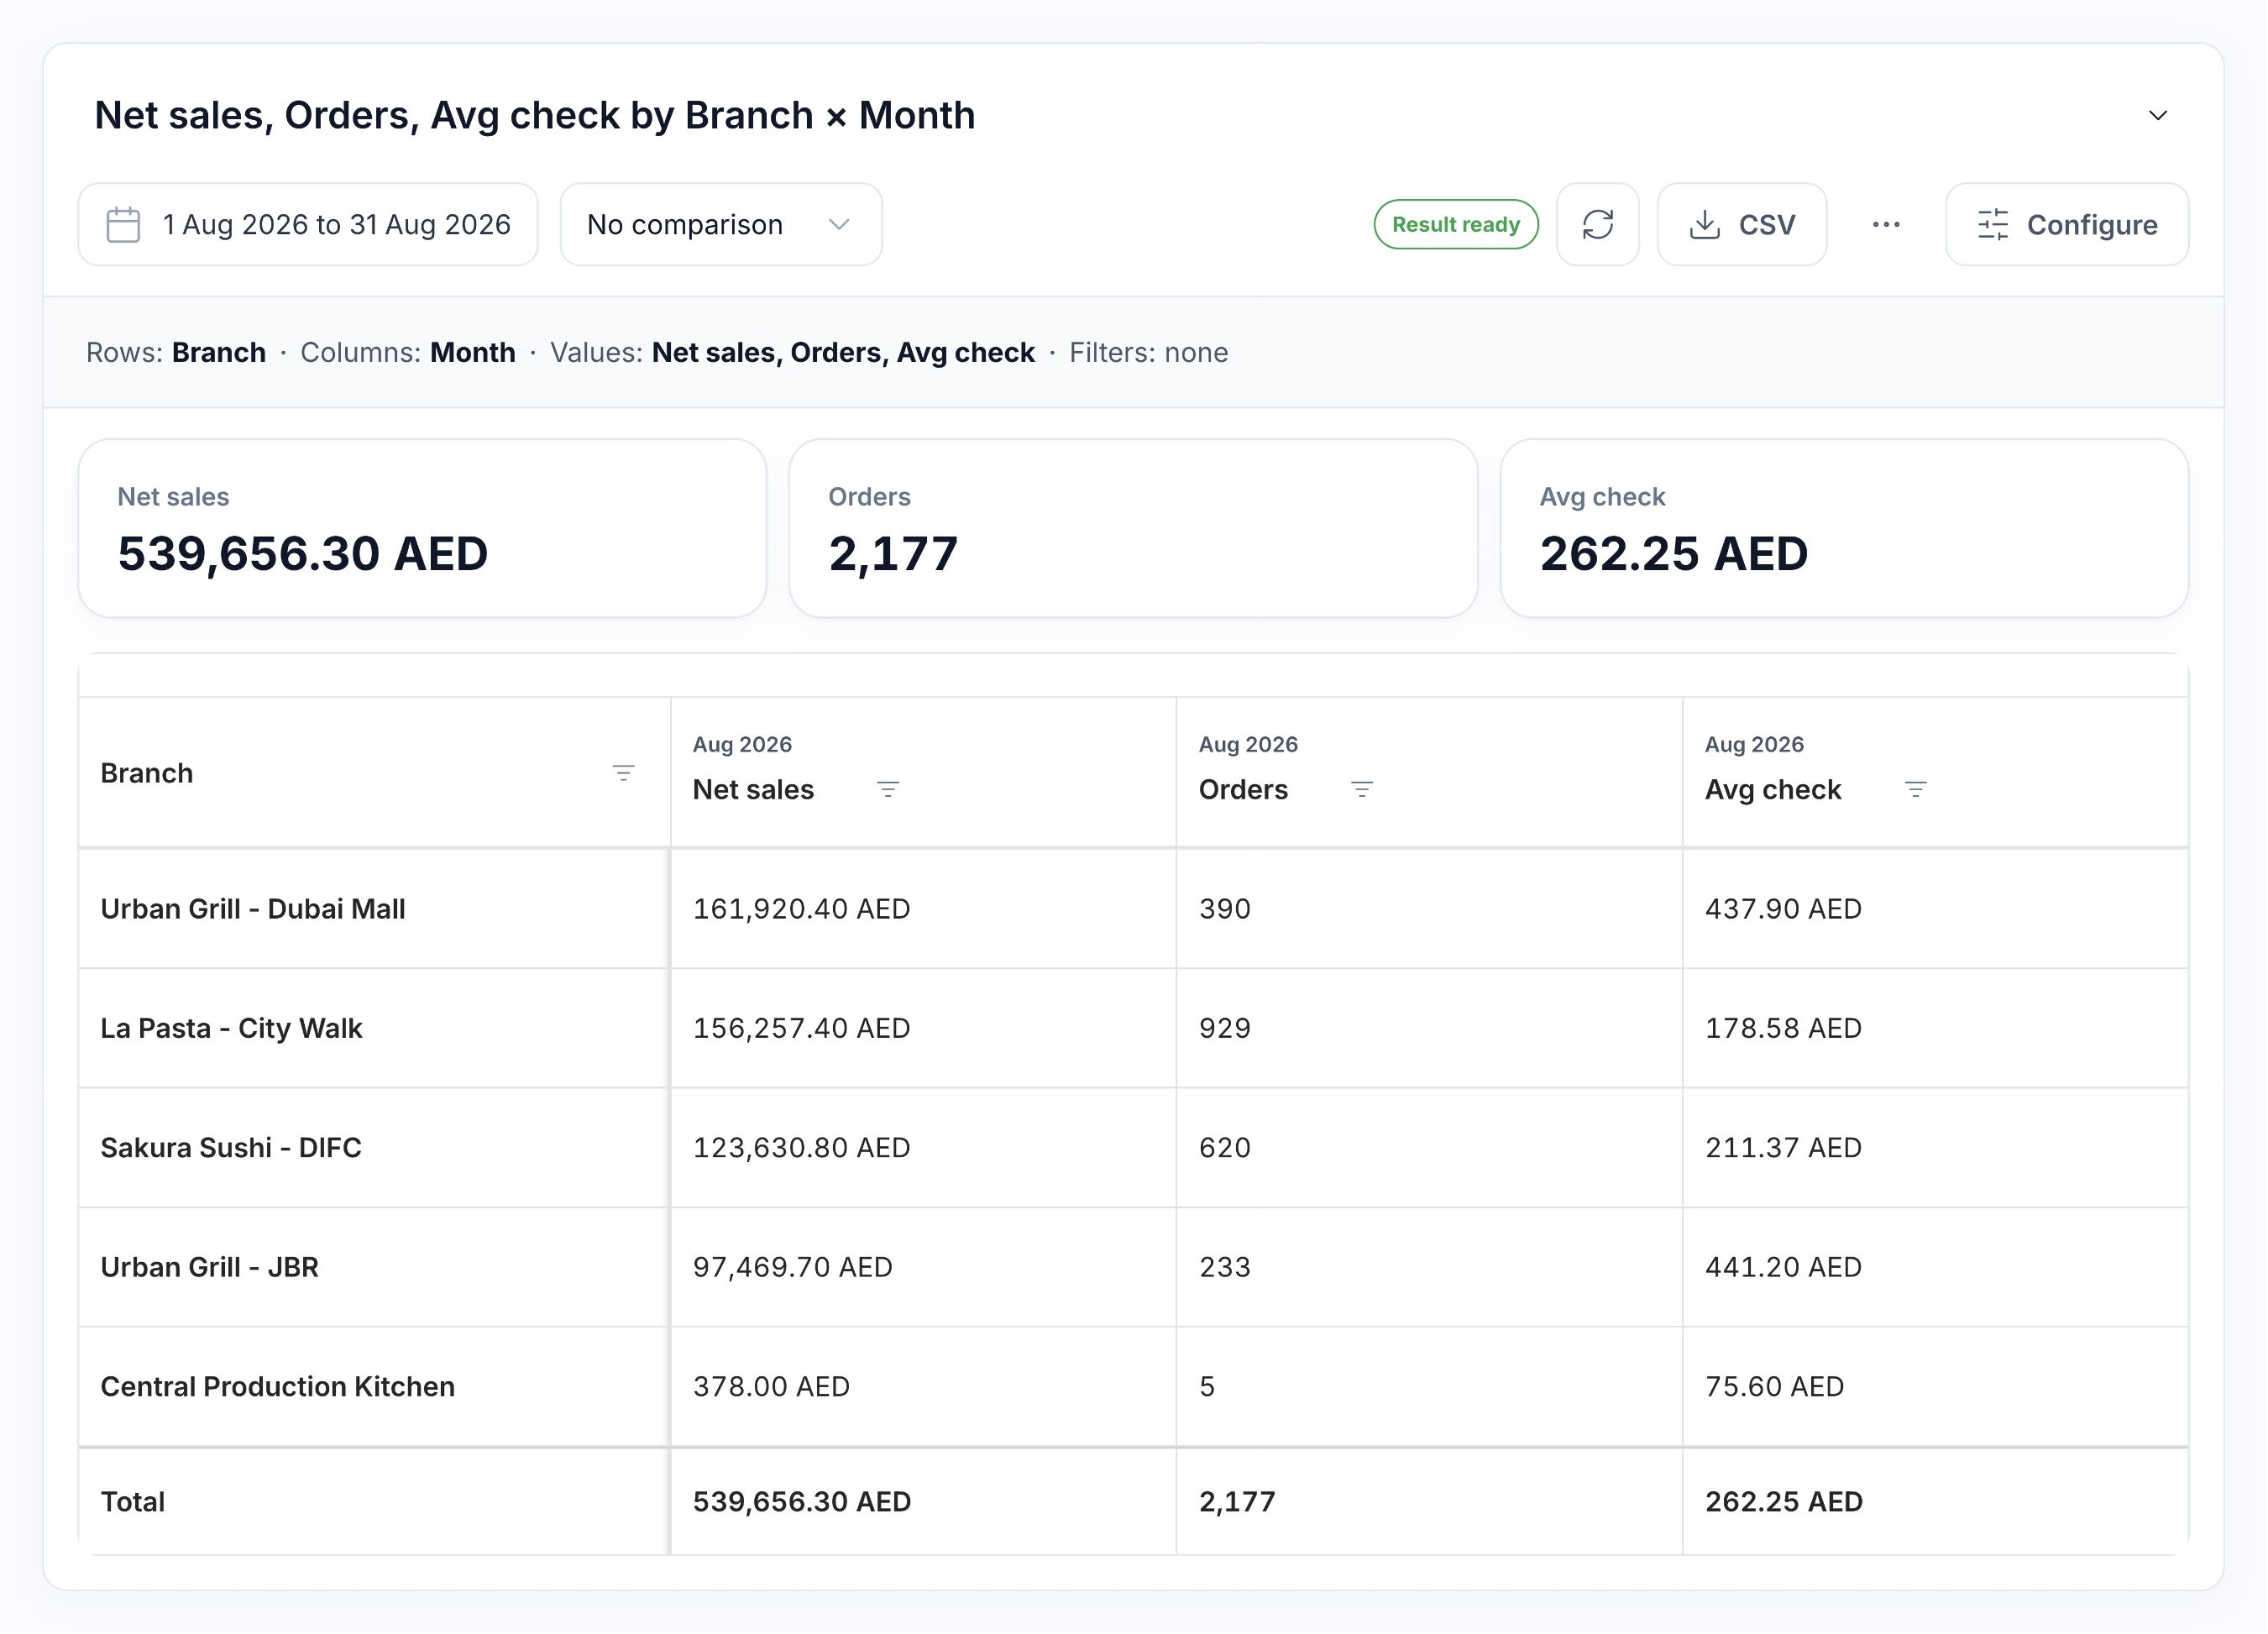
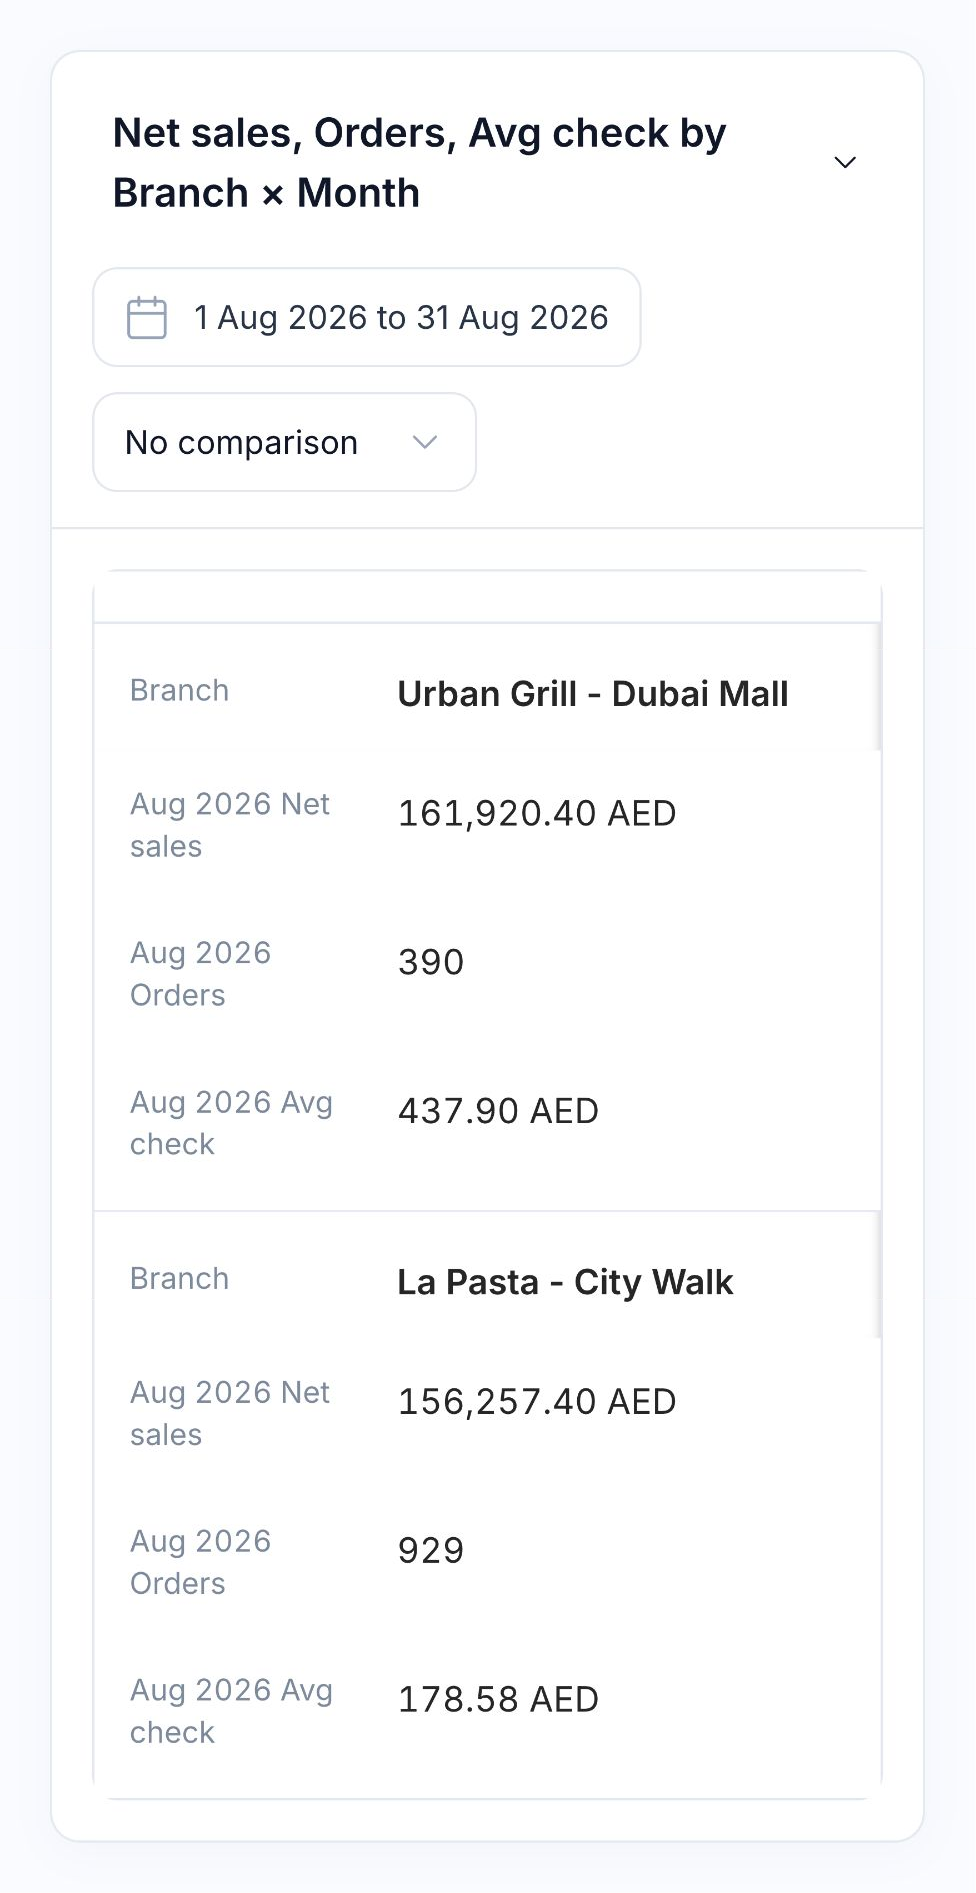
Report result

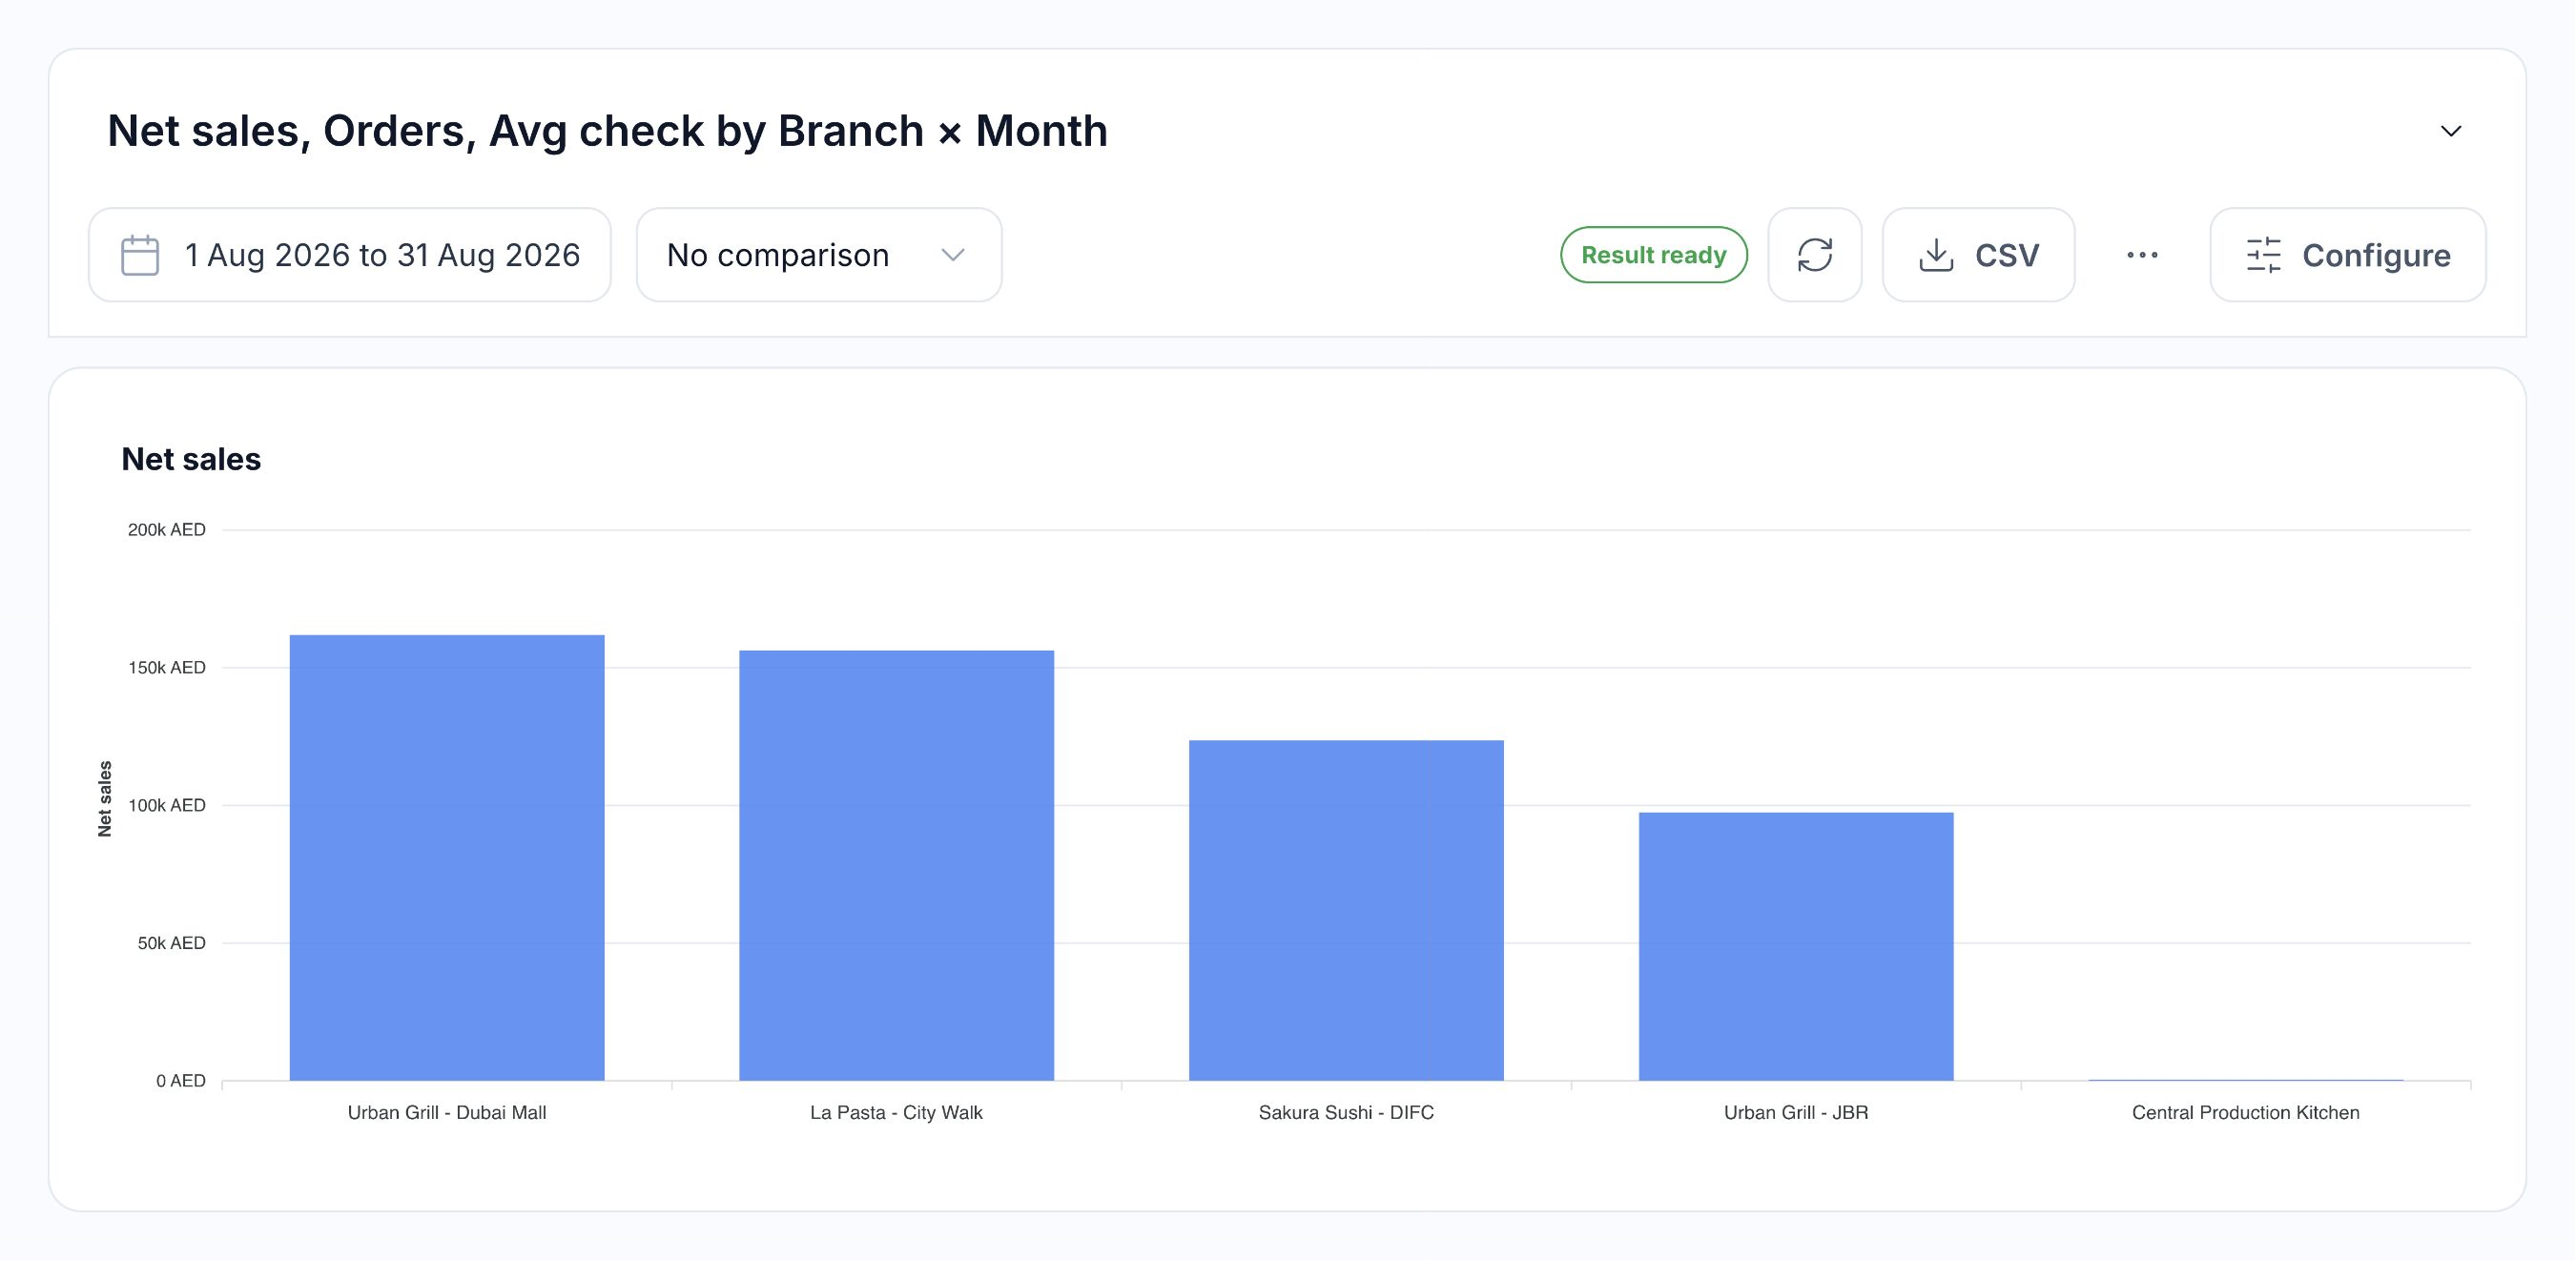
August net sales, orders and average check for five CityWalk Kitchen branches

Analytics Builder brings sales, kitchen, purchases, write-offs, payroll, inventory, labor, finance, customer and marketing data into one reporting workspace. Each source offers the dimensions and metrics relevant to that part of the restaurant.

  • Rows, columns and multiple measures
  • Branch, brand and period filters
  • Custom value groups
  • Sales, costs and operating data

02 / TEMPLATES & SAVED REPORTS

Save report templates for every review.

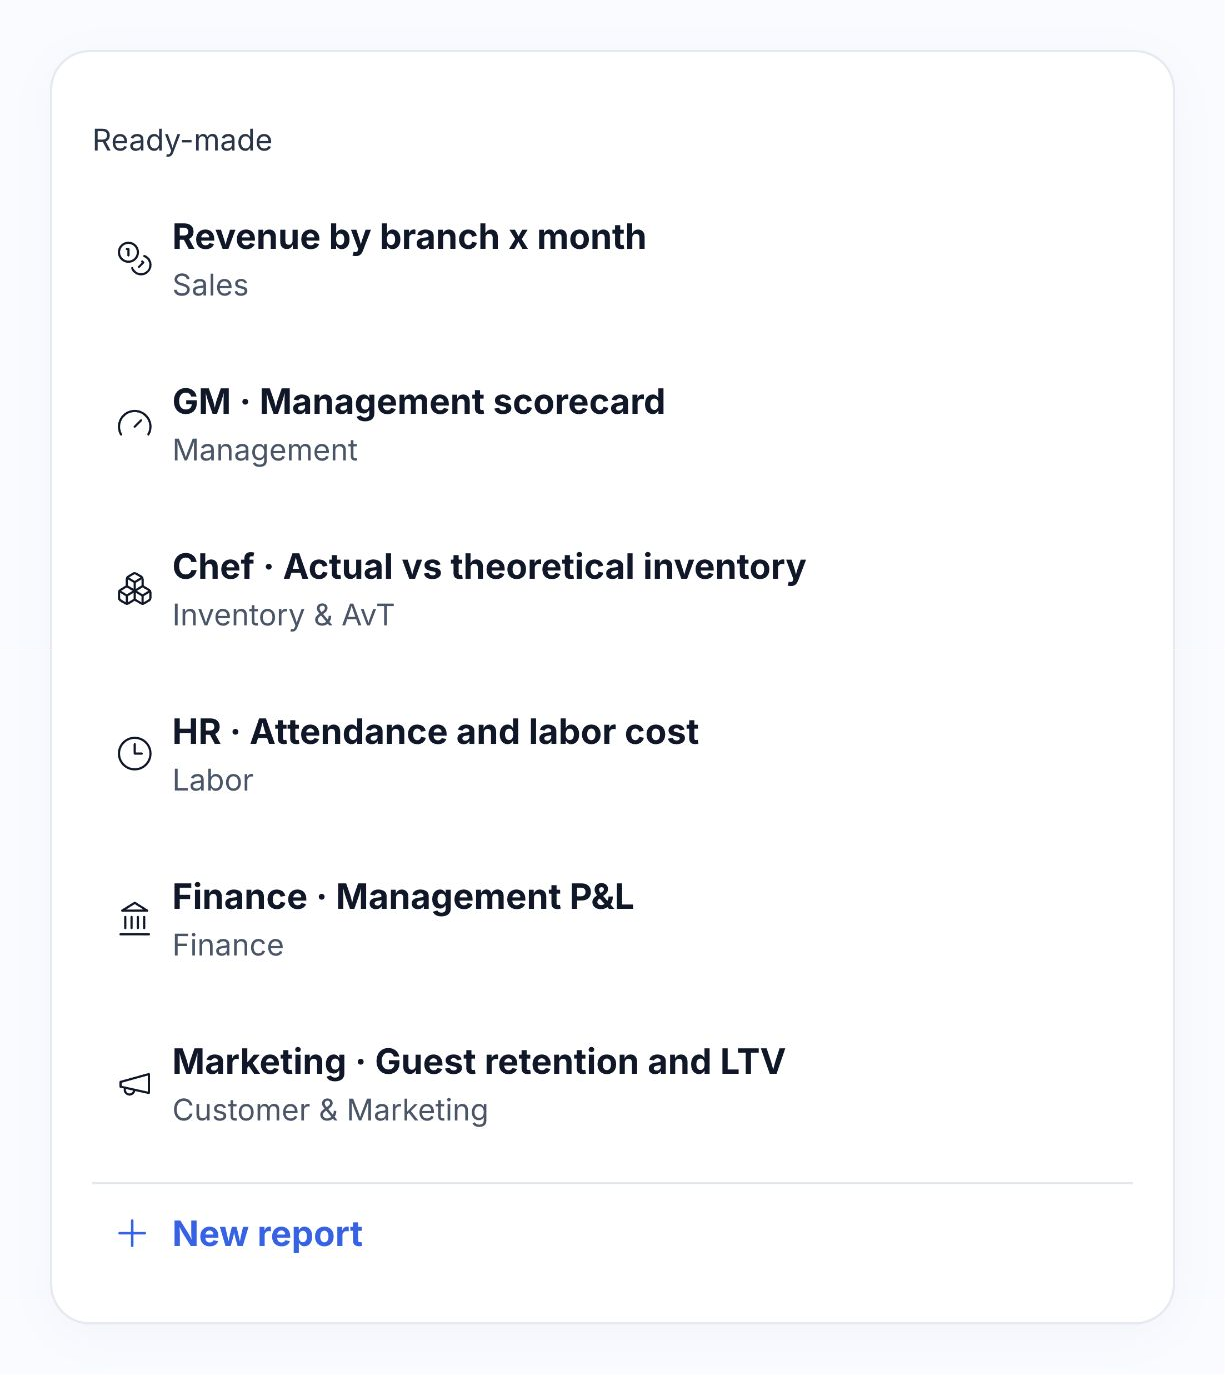
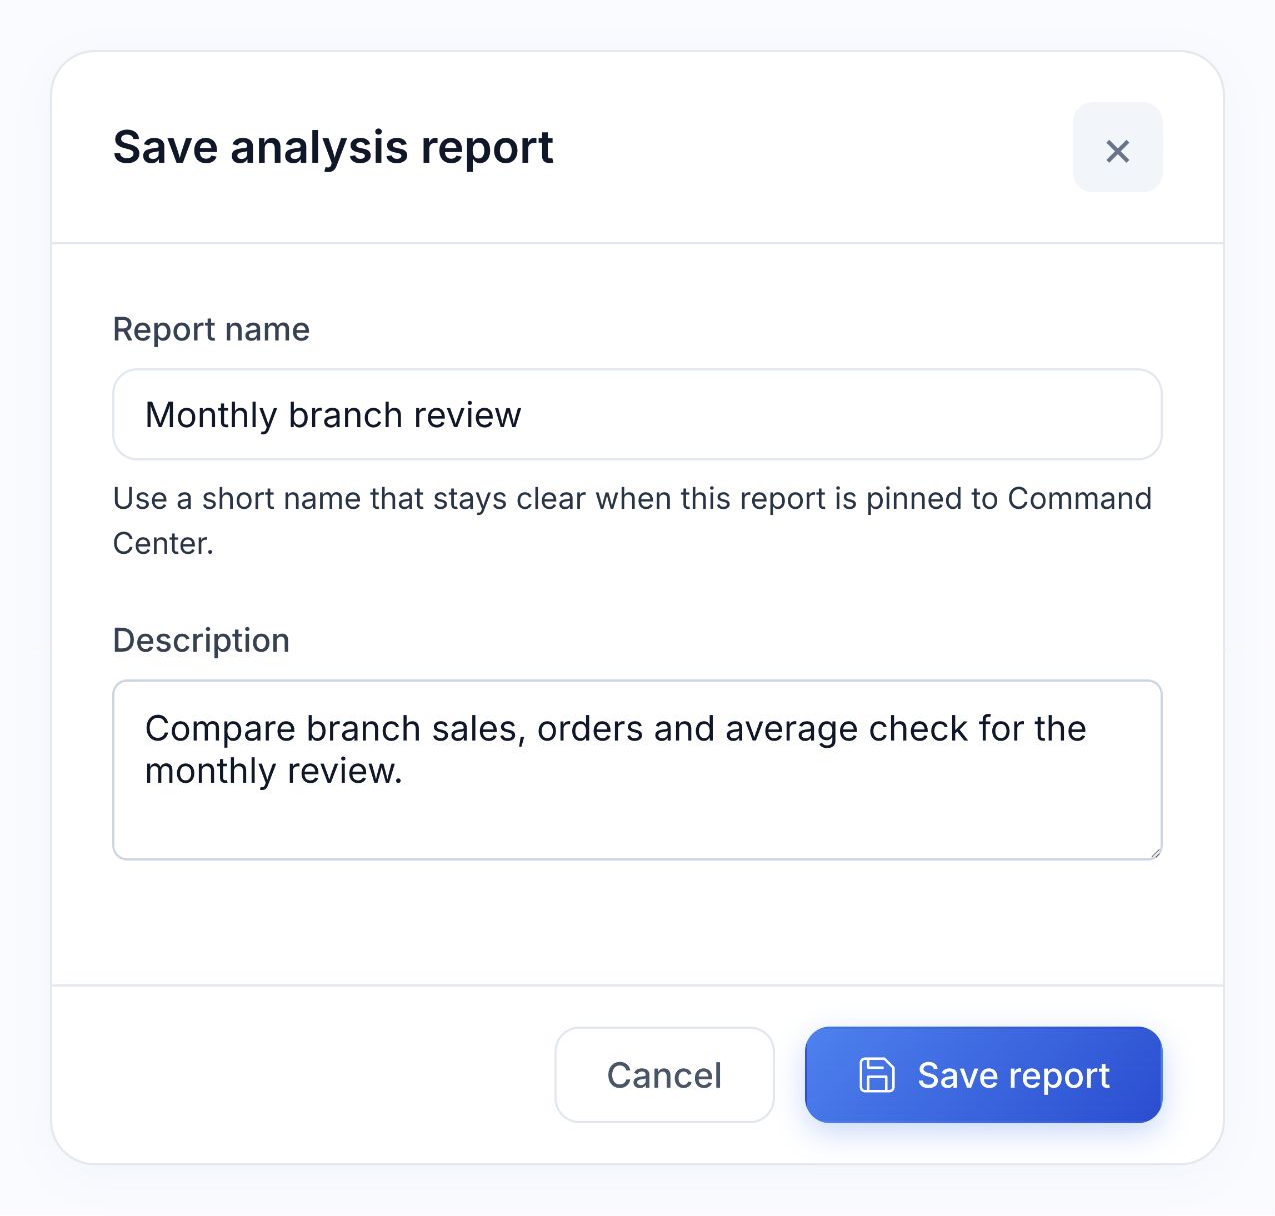
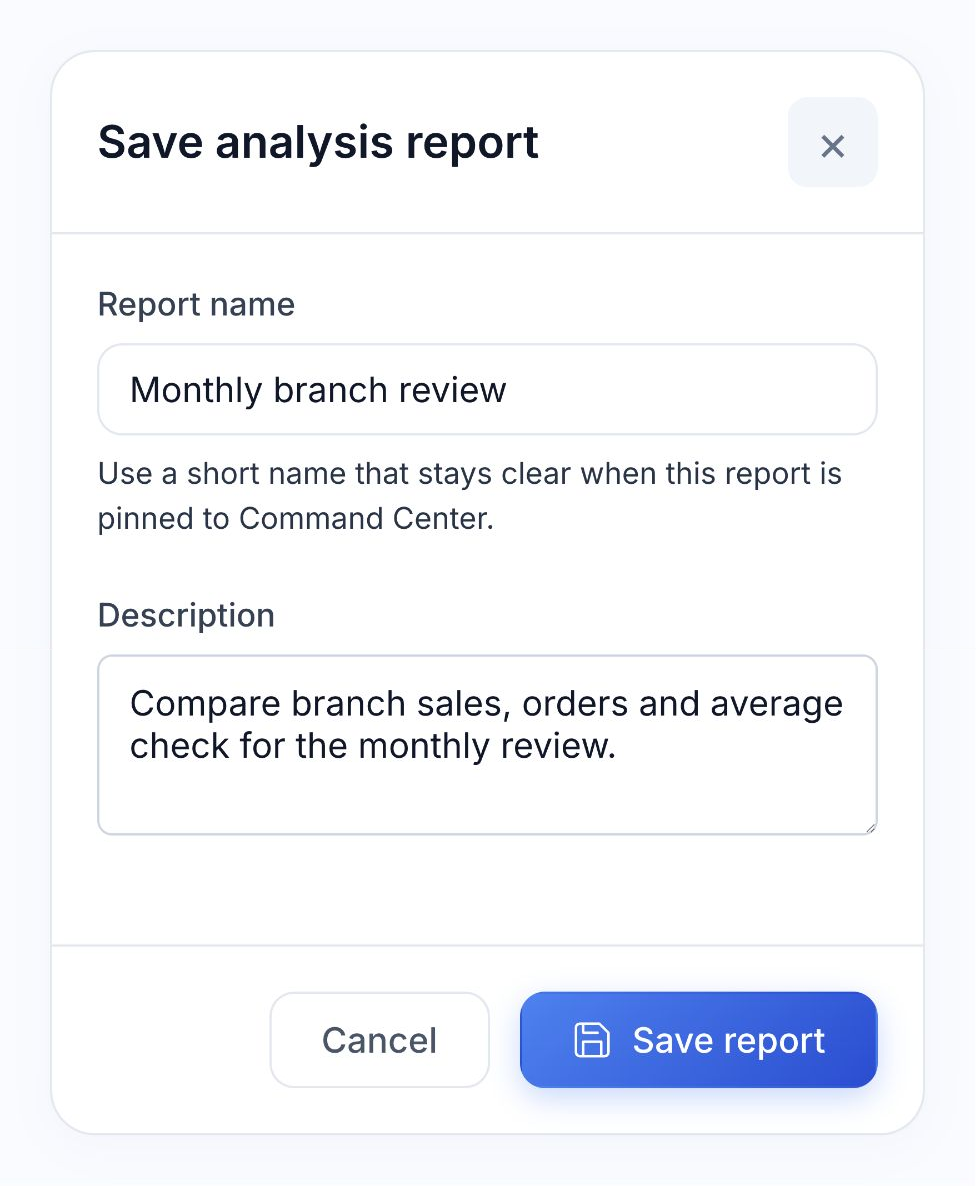
Start with a ready-made report for a manager, chef, finance team, HR or marketing. Adapt the source, filters and layout, give it a clear name and save it in My reports.

A saved report remembers its measures, custom groups, comparison and chart settings. Reopen it for the next month, update the existing version or use Save as to keep a separate variation. Pin frequently used reports to Command Center and refresh the figures when you need them.

  • Ready-made restaurant templates
  • Named reports with descriptions
  • Save changes or Save as
  • Pin saved reports to Command Center

Ready-made templates

Native ready-made report library with management, kitchen, HR, finance and marketing templates

Save your own

Native Save analysis report dialog with Monthly branch review entered as an unsaved report name

03 / COMPARE & DRILL DOWN

See what changed. Open what caused it.

Compare the previous period or the same period last year. Keep sales, order count and average check together to see whether a branch’s change came with fewer orders or a different check value.

Branch results

Native column chart of August net sales by branch
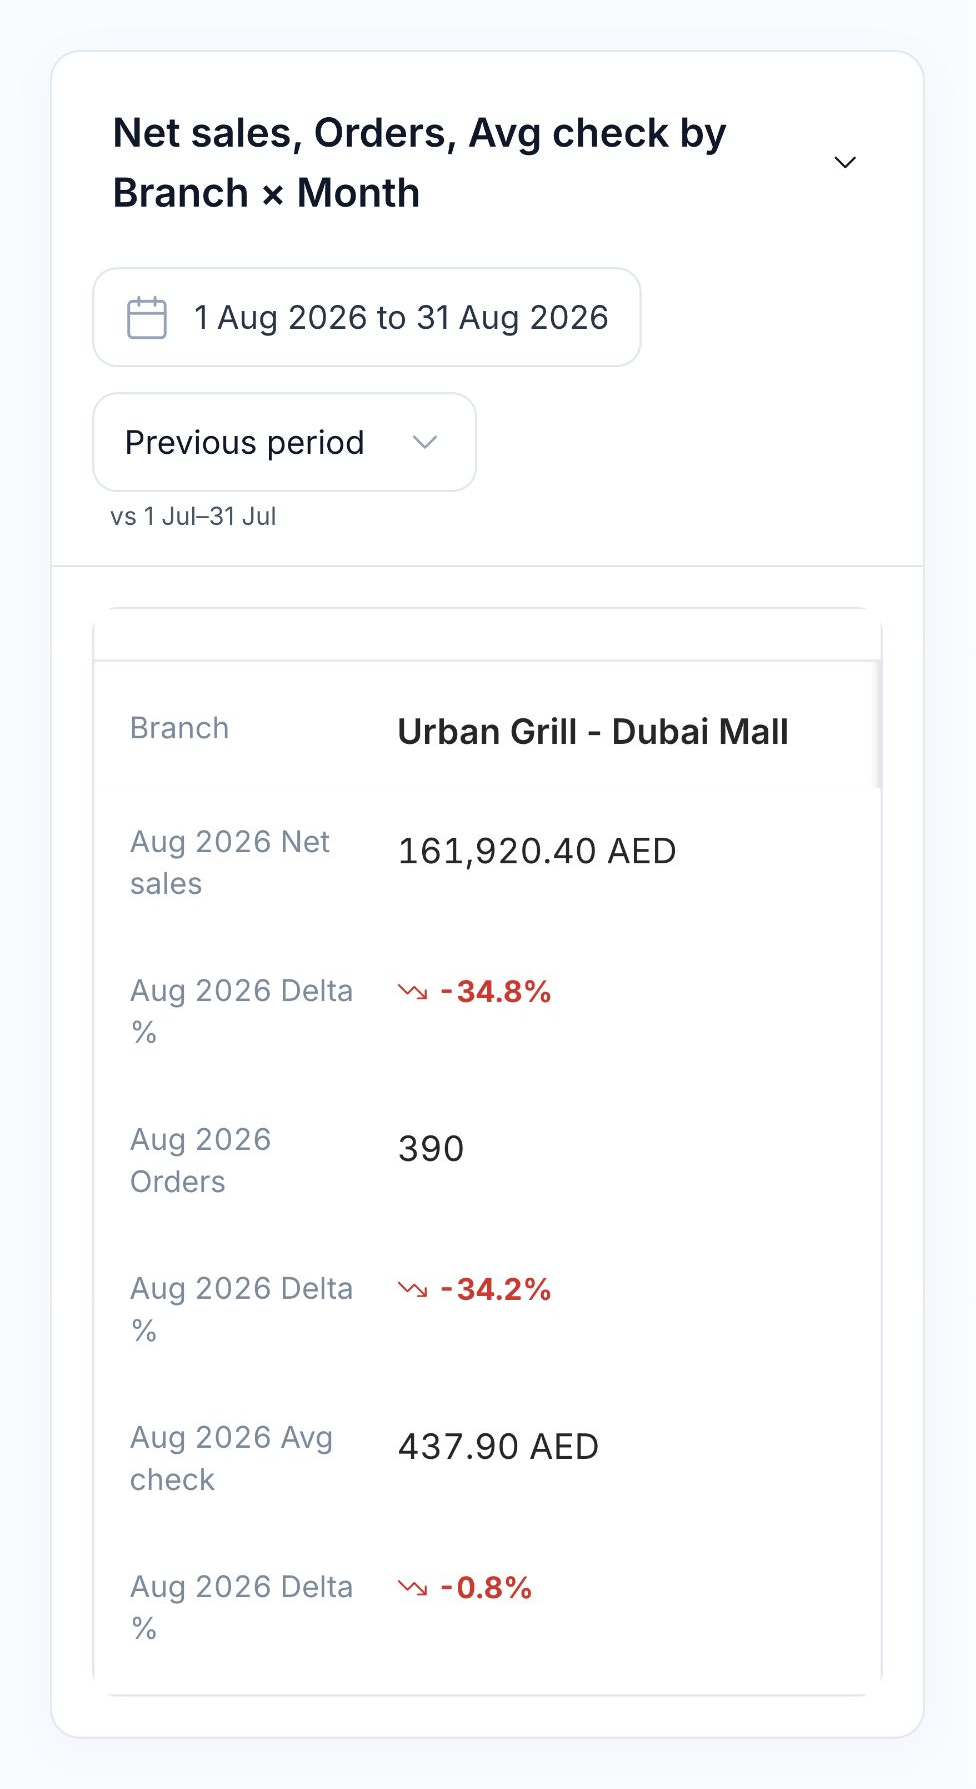
August branch sales, orders and average check as readable native report records

Period comparison

August branch results compared with July, including change for each measure

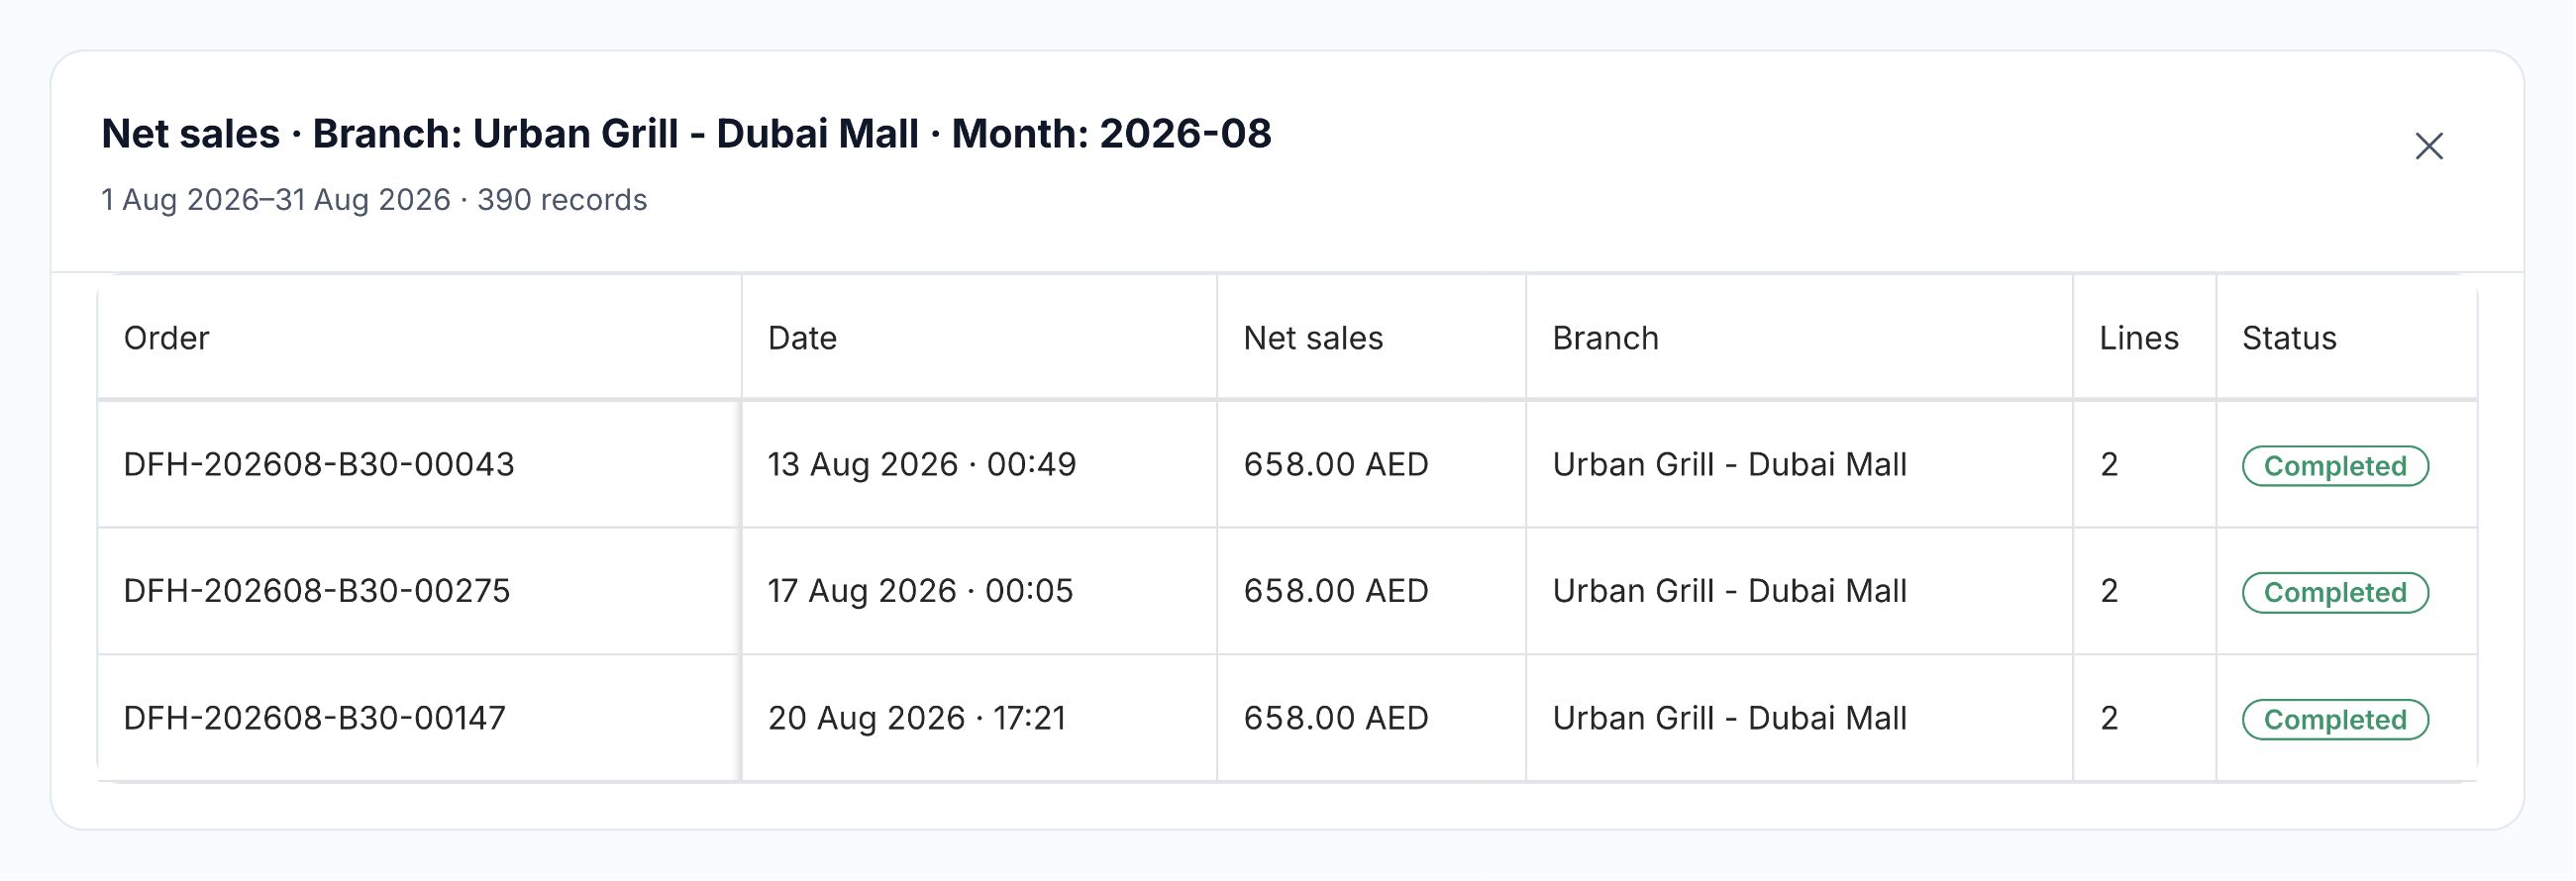
Source orders

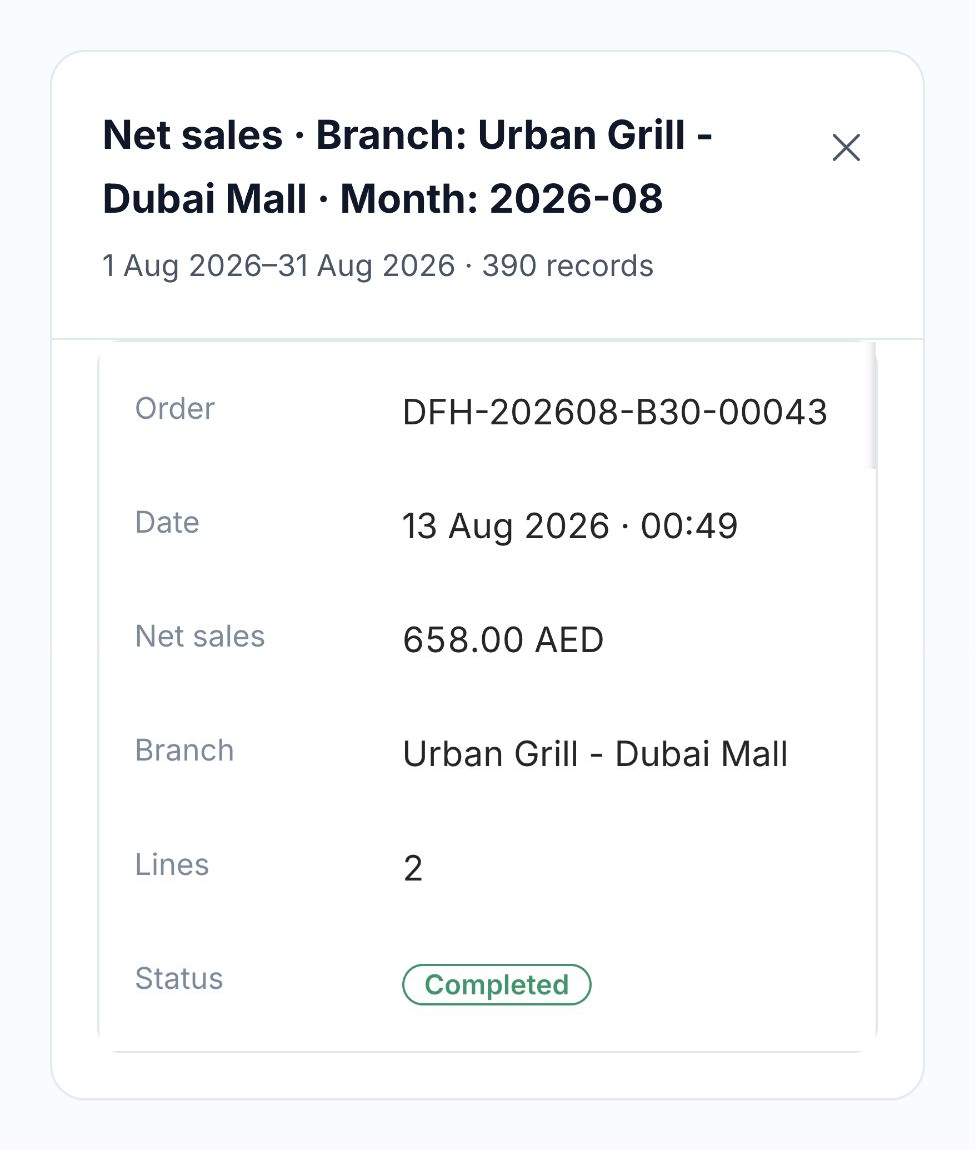
Native drill-down showing August source orders for Urban Grill Dubai Mall, selected from its net sales result

Switch between tables, column charts, line charts and heatmaps. Show shares or cumulative values, highlight drops and focus on the leading results. Open a figure to inspect its source orders or documents with the selected branch and period carried into the detail.

  • Previous period and year-on-year
  • Table, columns, line and heatmap
  • Percentages, cumulative values and highlights
  • Drill-down to source records

04 / HOREX INTELLIGENCE

Start a report with a question.

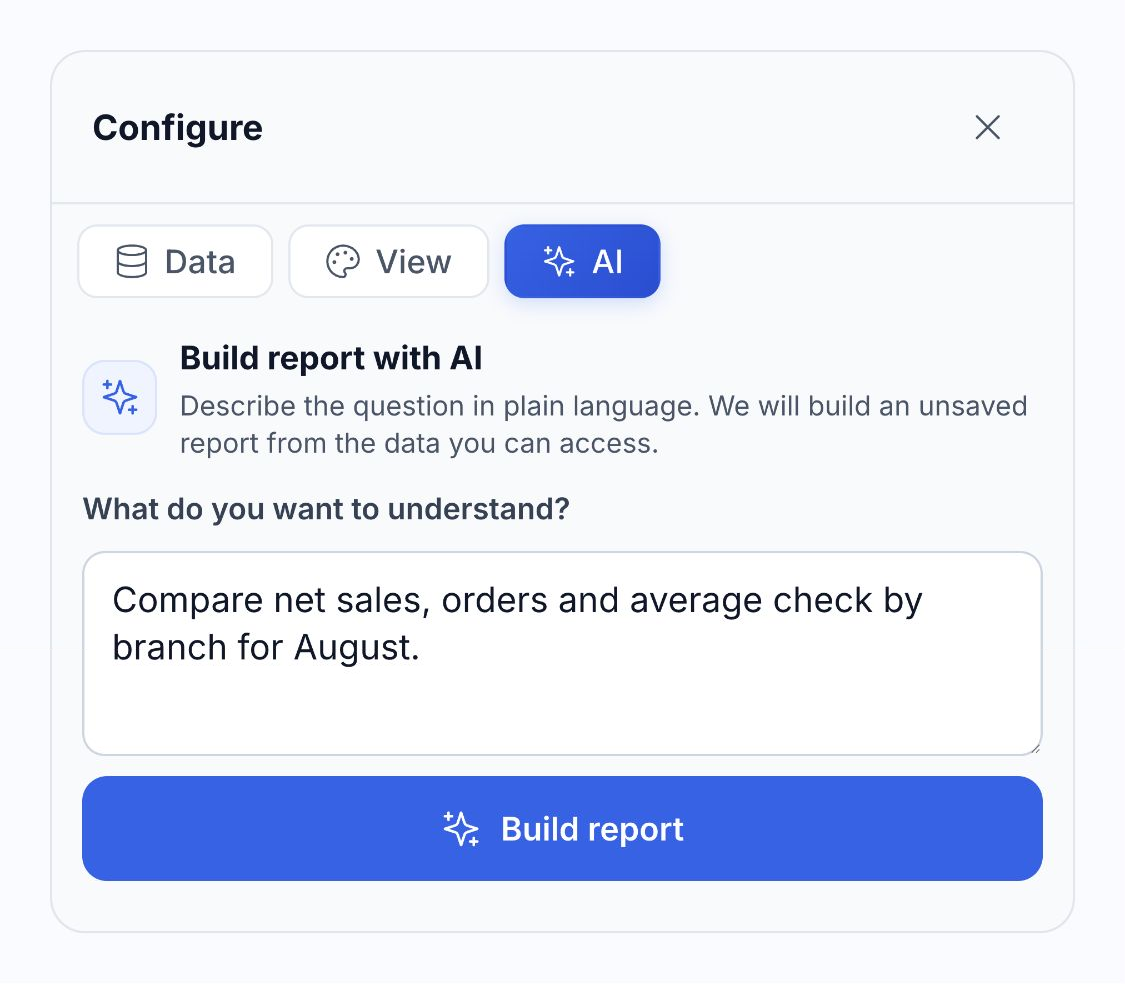
Describe what you want to understand: “Compare net sales, orders and average check by branch for August.” HoreX Intelligence can prepare an unsaved report using the data you have access to.

Review the source, measures and filters in Analytics Builder, adjust the draft and save the useful version. Your team can move from an initial question to a repeatable report without starting with an empty layout.

  • Natural-language report drafts
  • Review and adjust before saving
  • Data access follows permissions
  • Available with HoreX Intelligence
Actual HoreX report AI composer with a branch comparison question entered, before generating a draft

06 / SHIFT REVIEW

Review the shift, payments and exceptions.

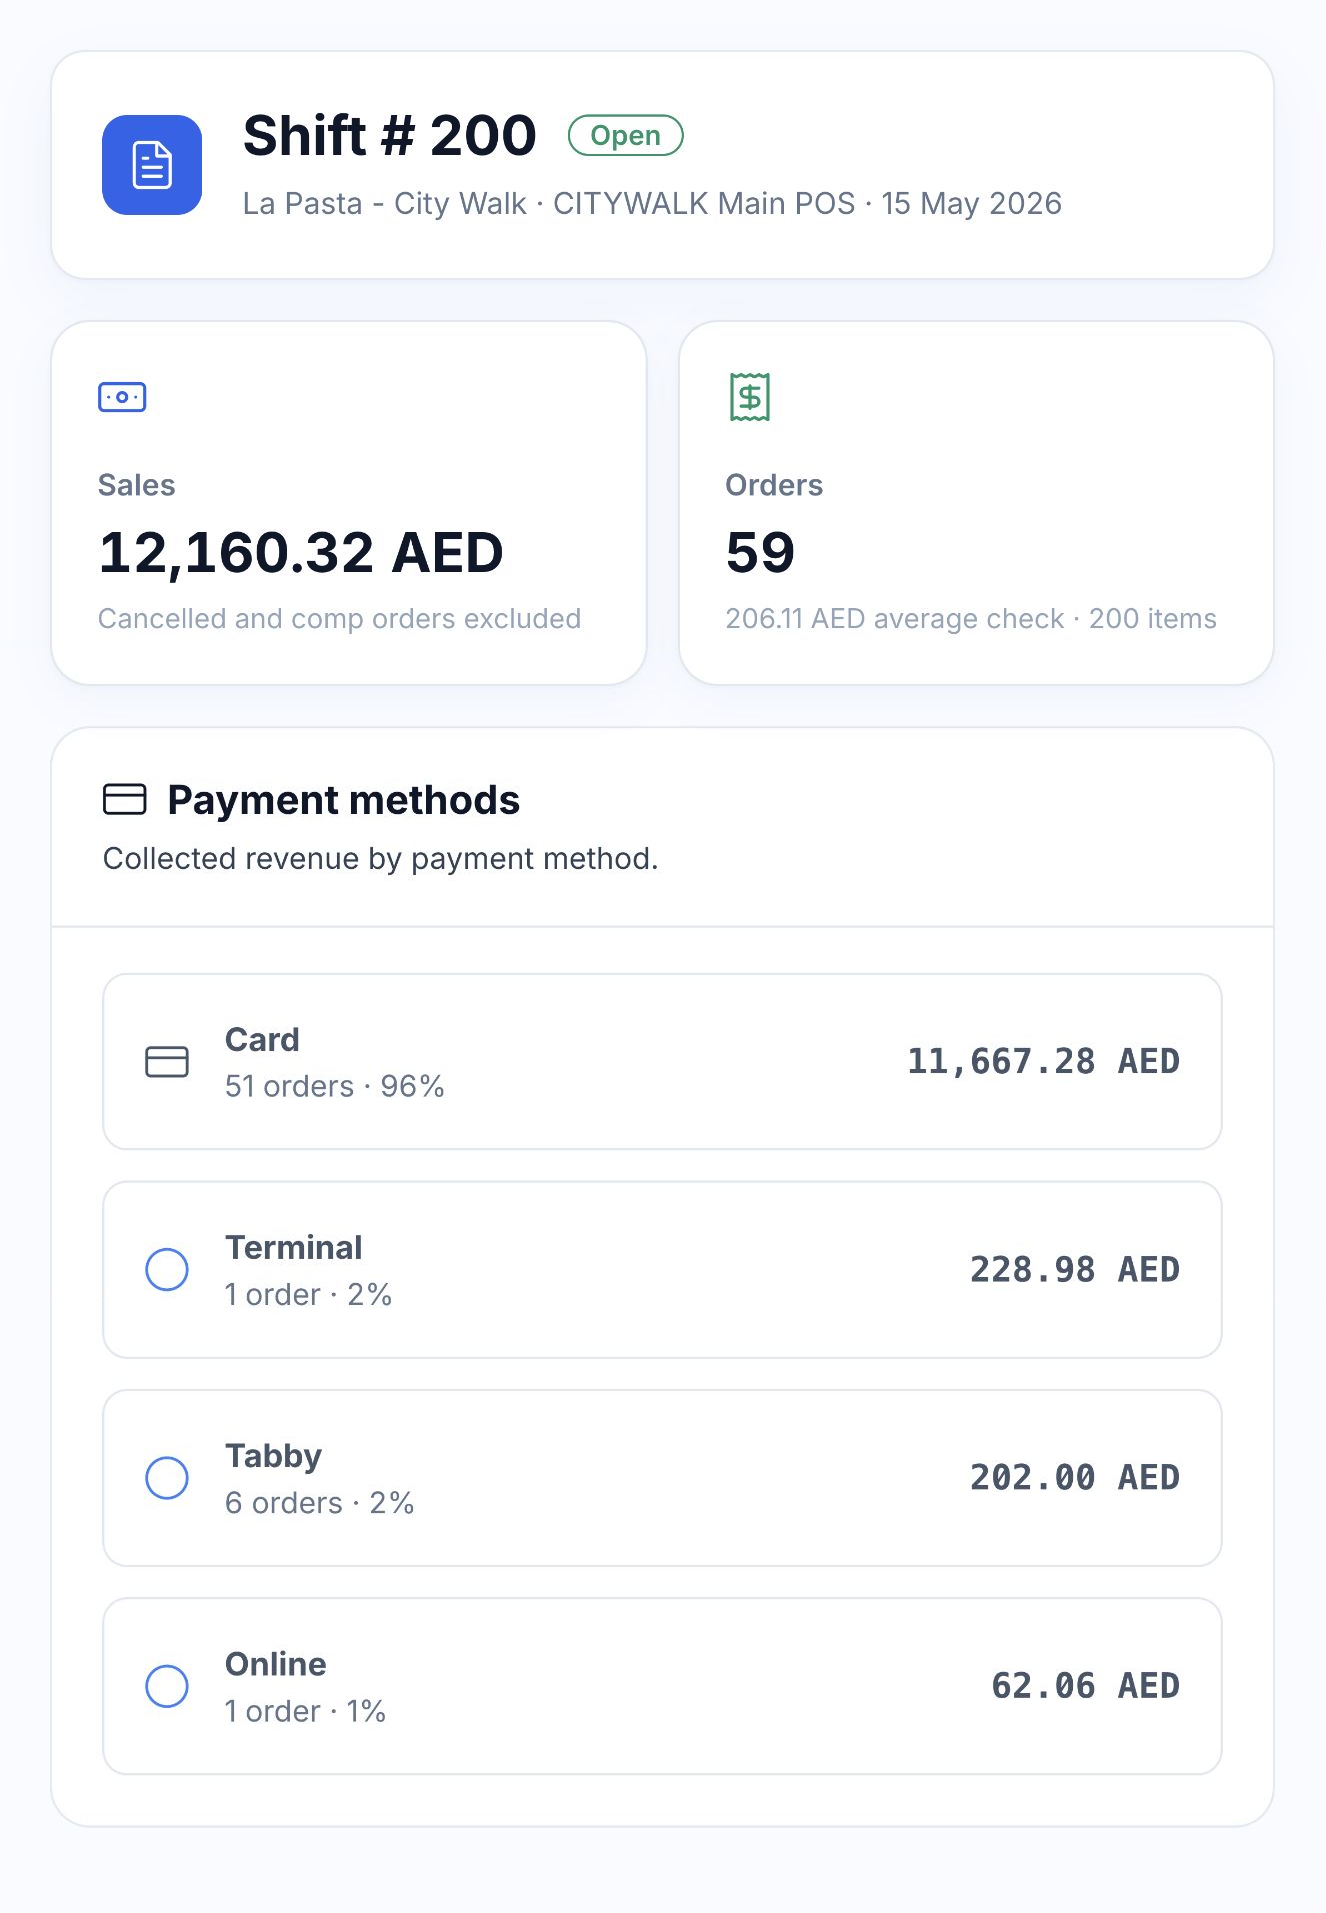
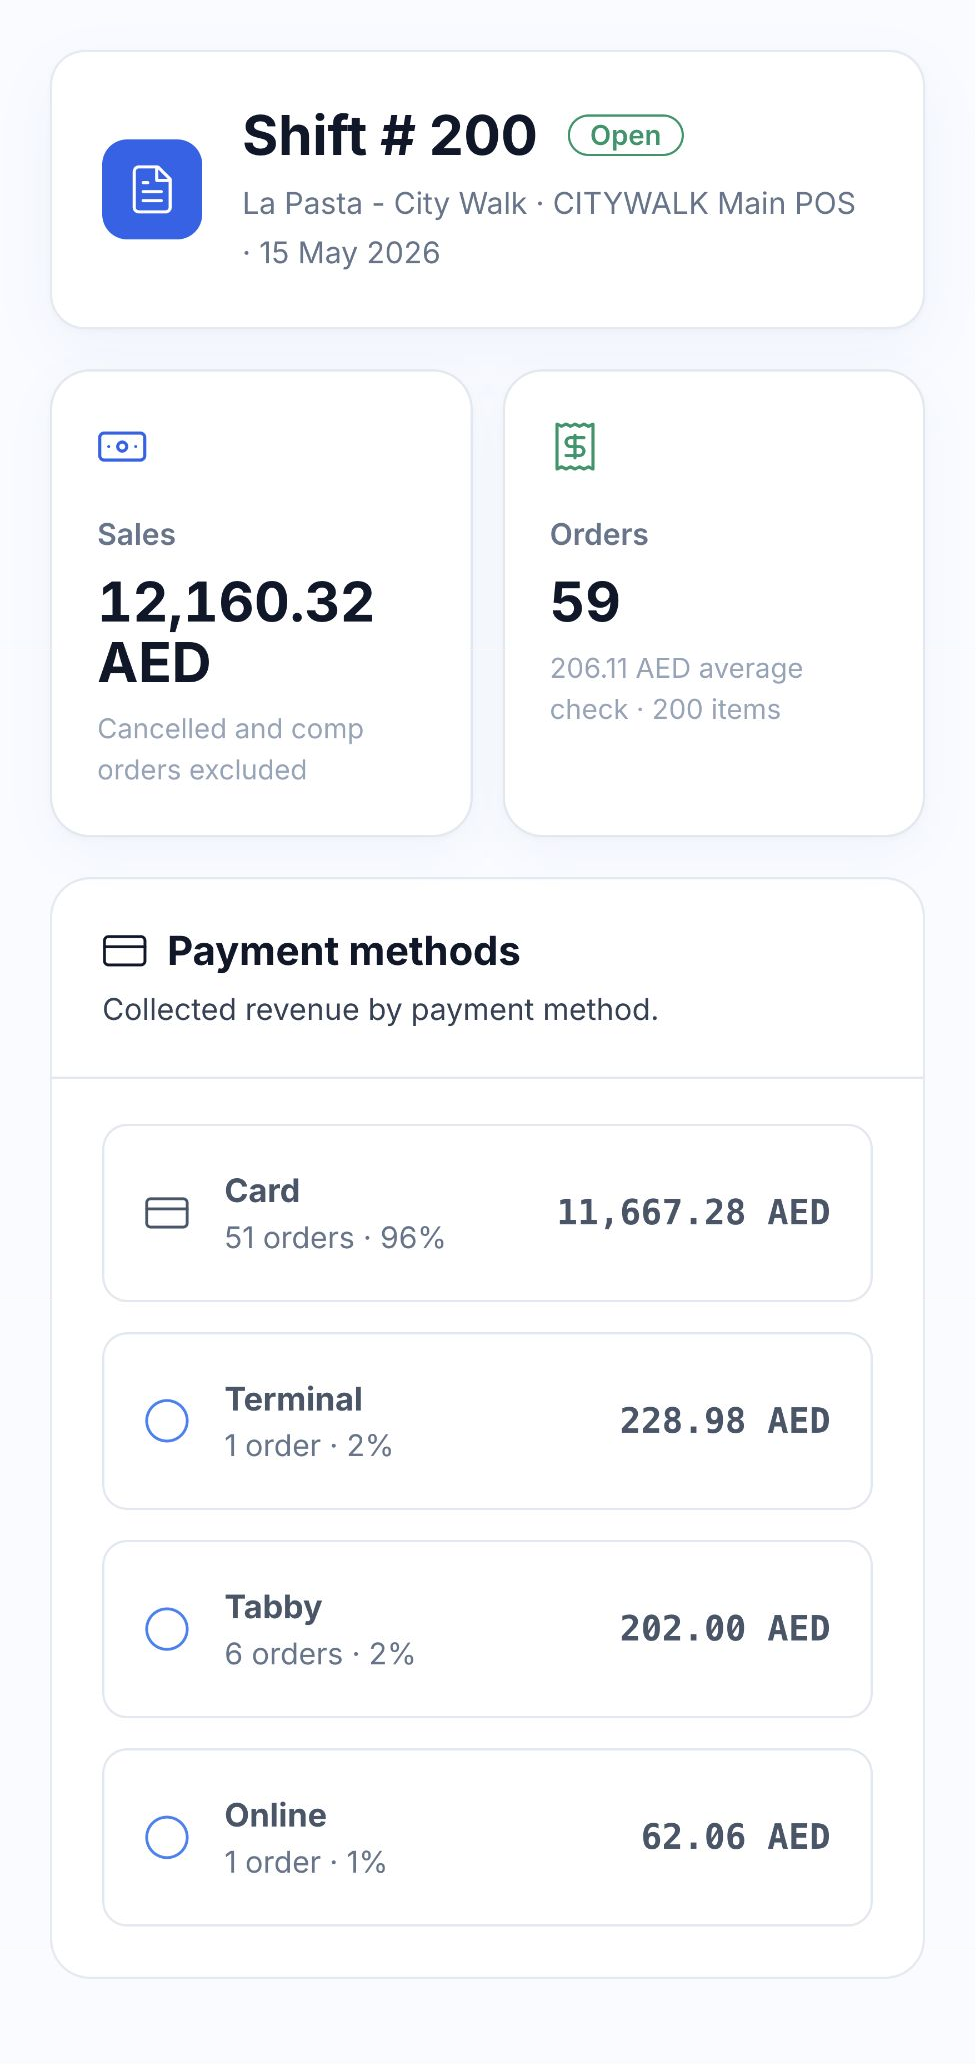
Review the shift’s orders and payment totals against the cash and payment records at handover. Open discounts, complimentary orders or payment changes when something needs explaining.

The order reference, operator and recorded reason give the manager a starting point. A variance needs investigation before it becomes a conclusion about a member of staff.

  • Shift and payment totals
  • Discounts and comps
  • Voids and payment changes
  • Order-level context
Native La Pasta City Walk shift report with 59 orders, AED 12,160.32 sales and four payment methods

07 / STOCK & PURCHASING COSTS

Separate price changes from quantity changes.

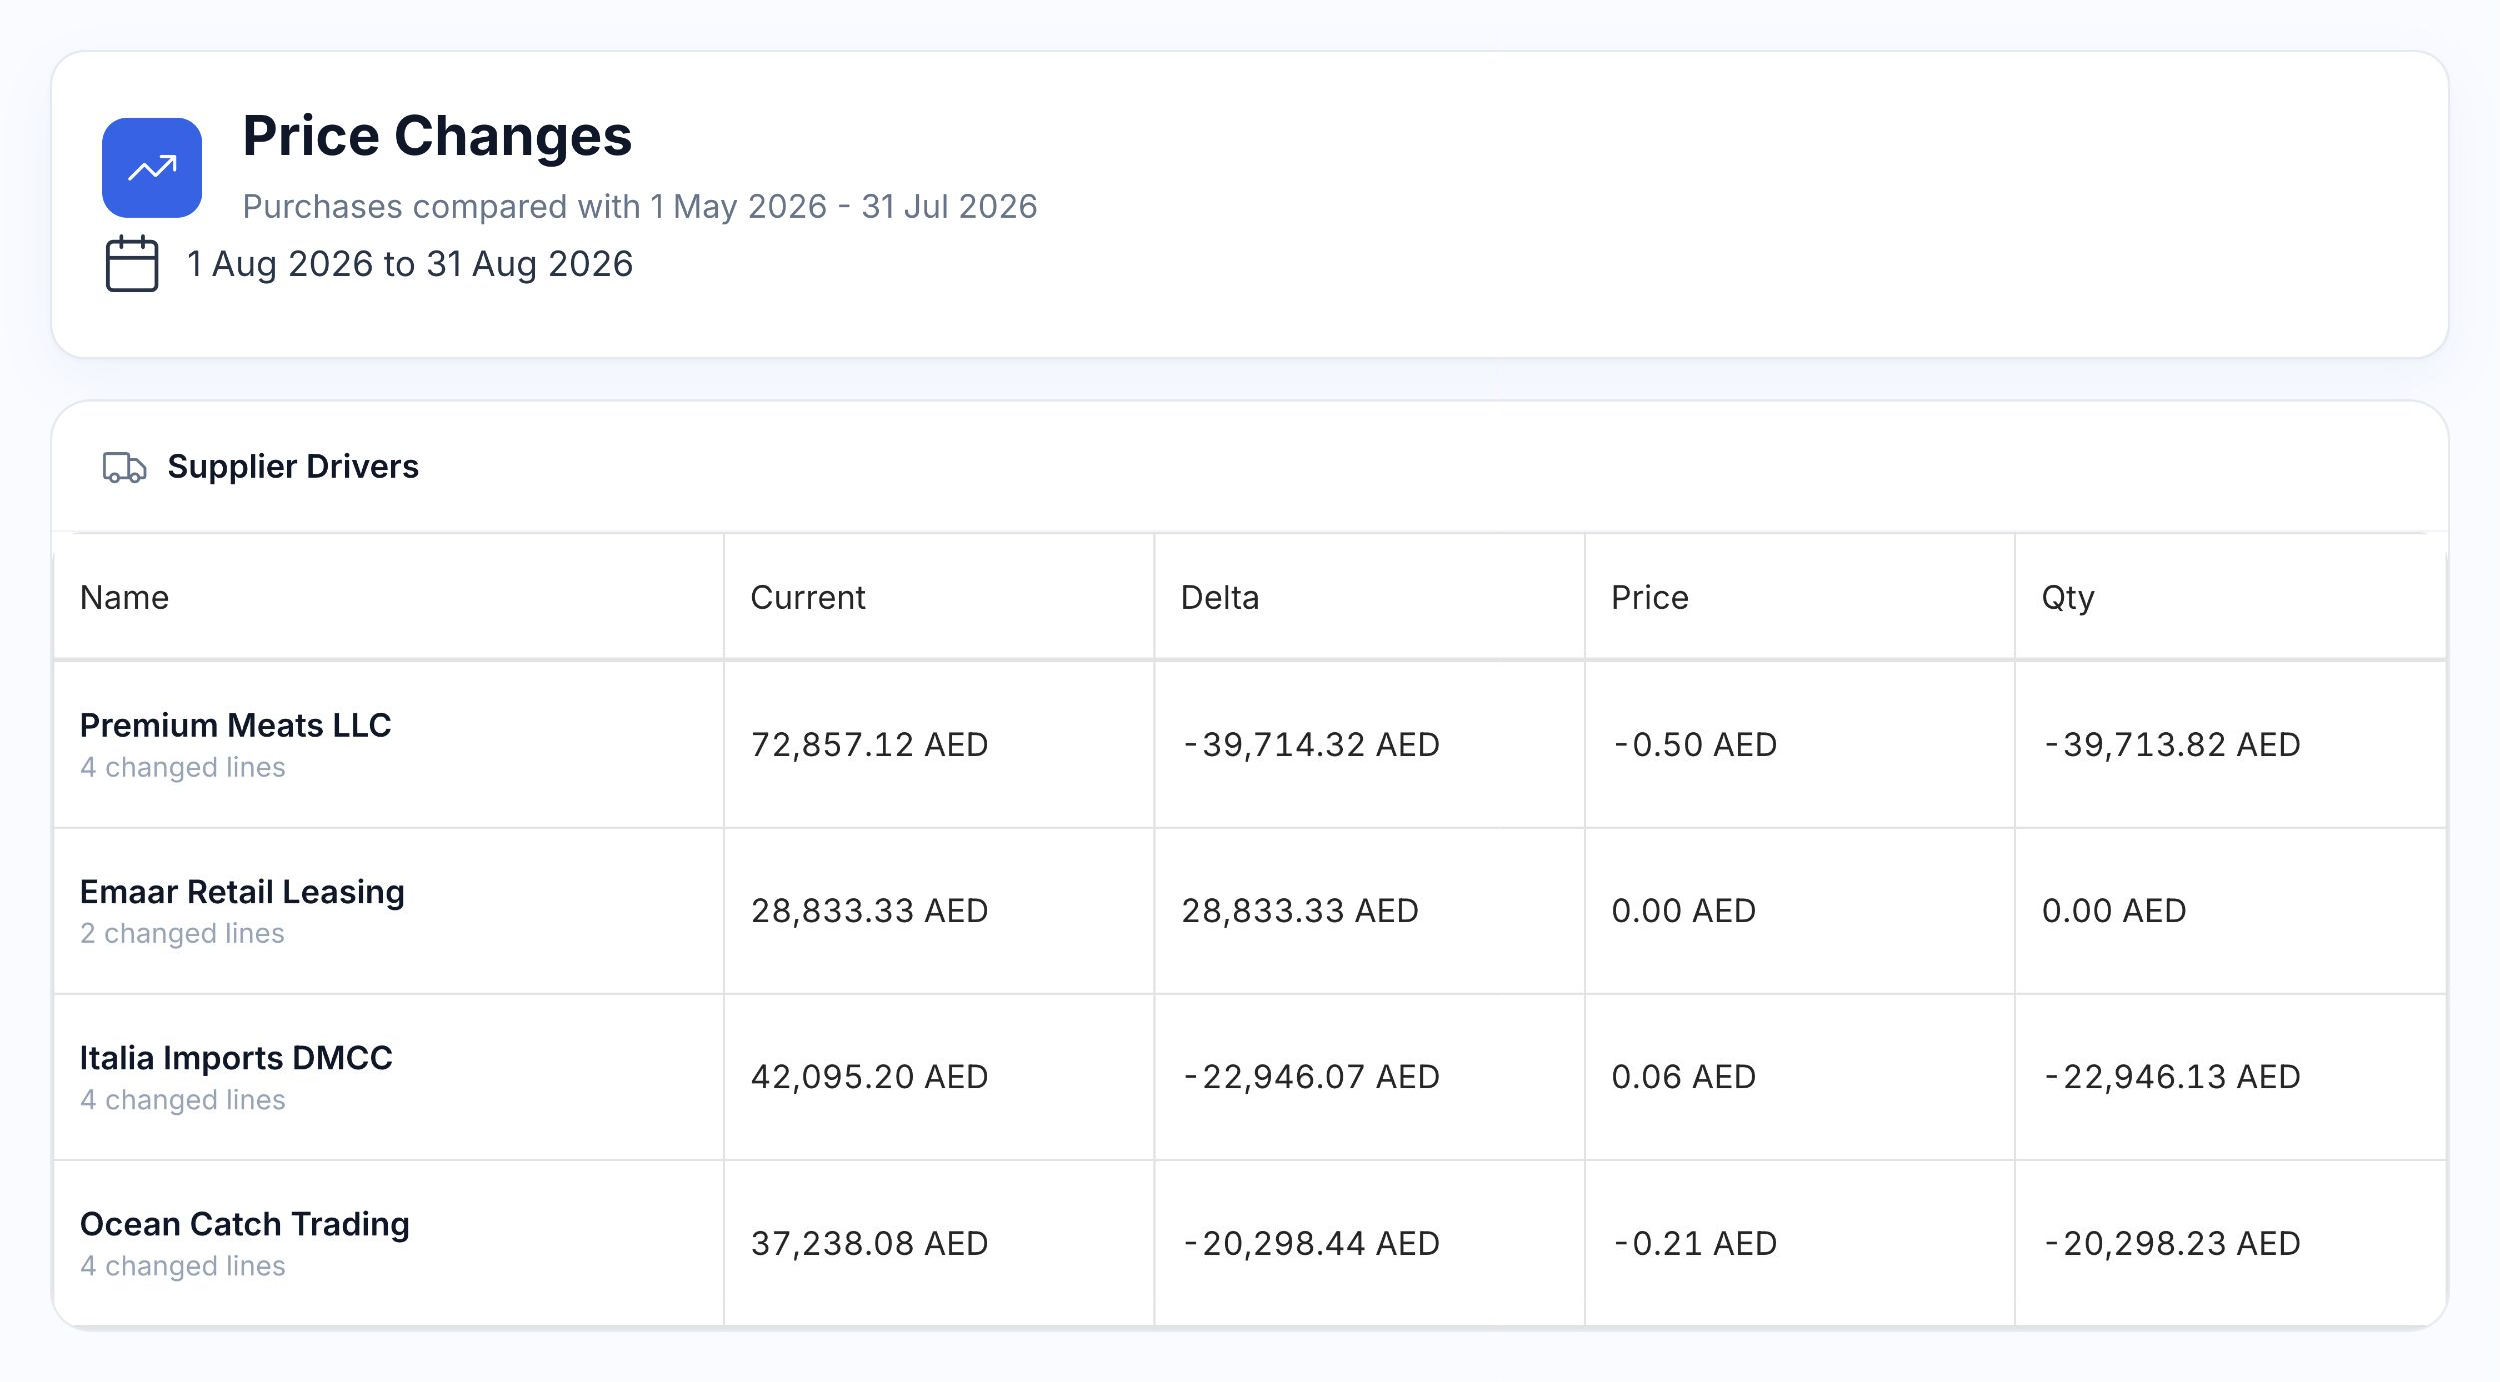
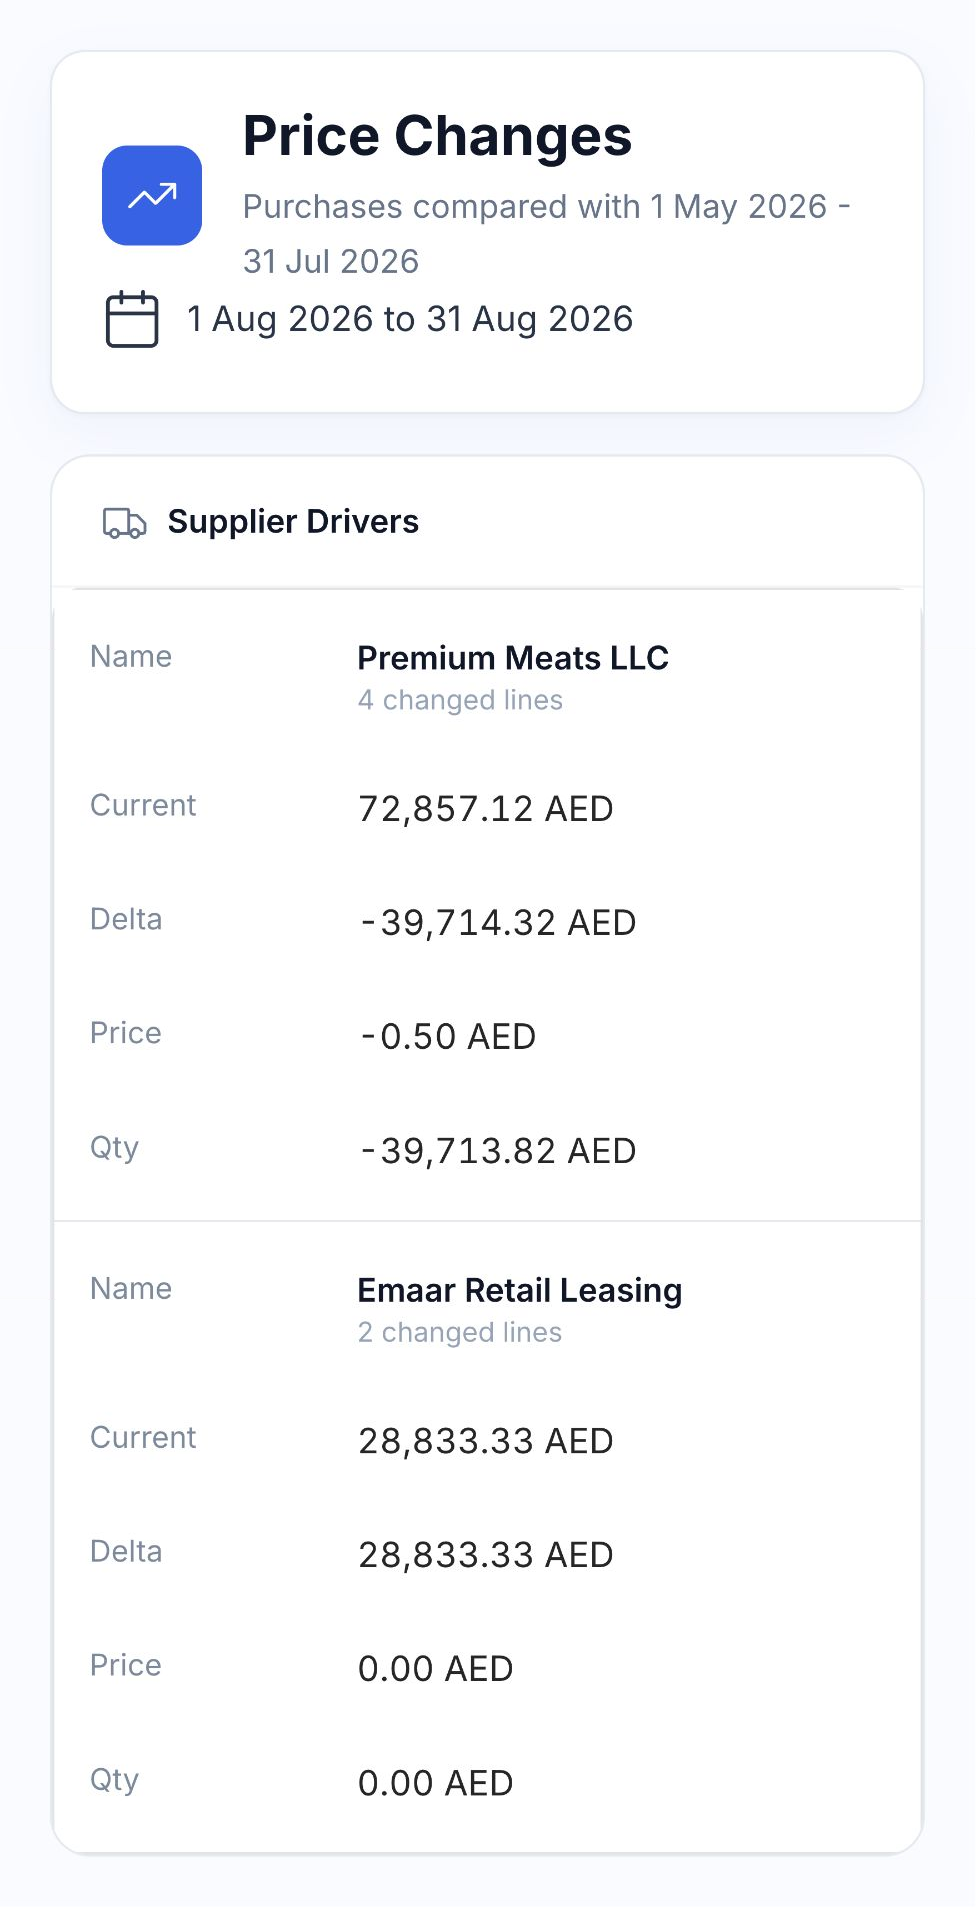
A higher purchasing total can come from a different unit price, more quantity or a different mix of products. Price Changes separates the estimated price and quantity effects and shows the suppliers, products and invoices behind them. Compare with a previous period or an average of earlier months.

Purchasing costs

Native Price Changes report comparing August supplier spend, price effect and quantity effect with the previous three months

Stock movements

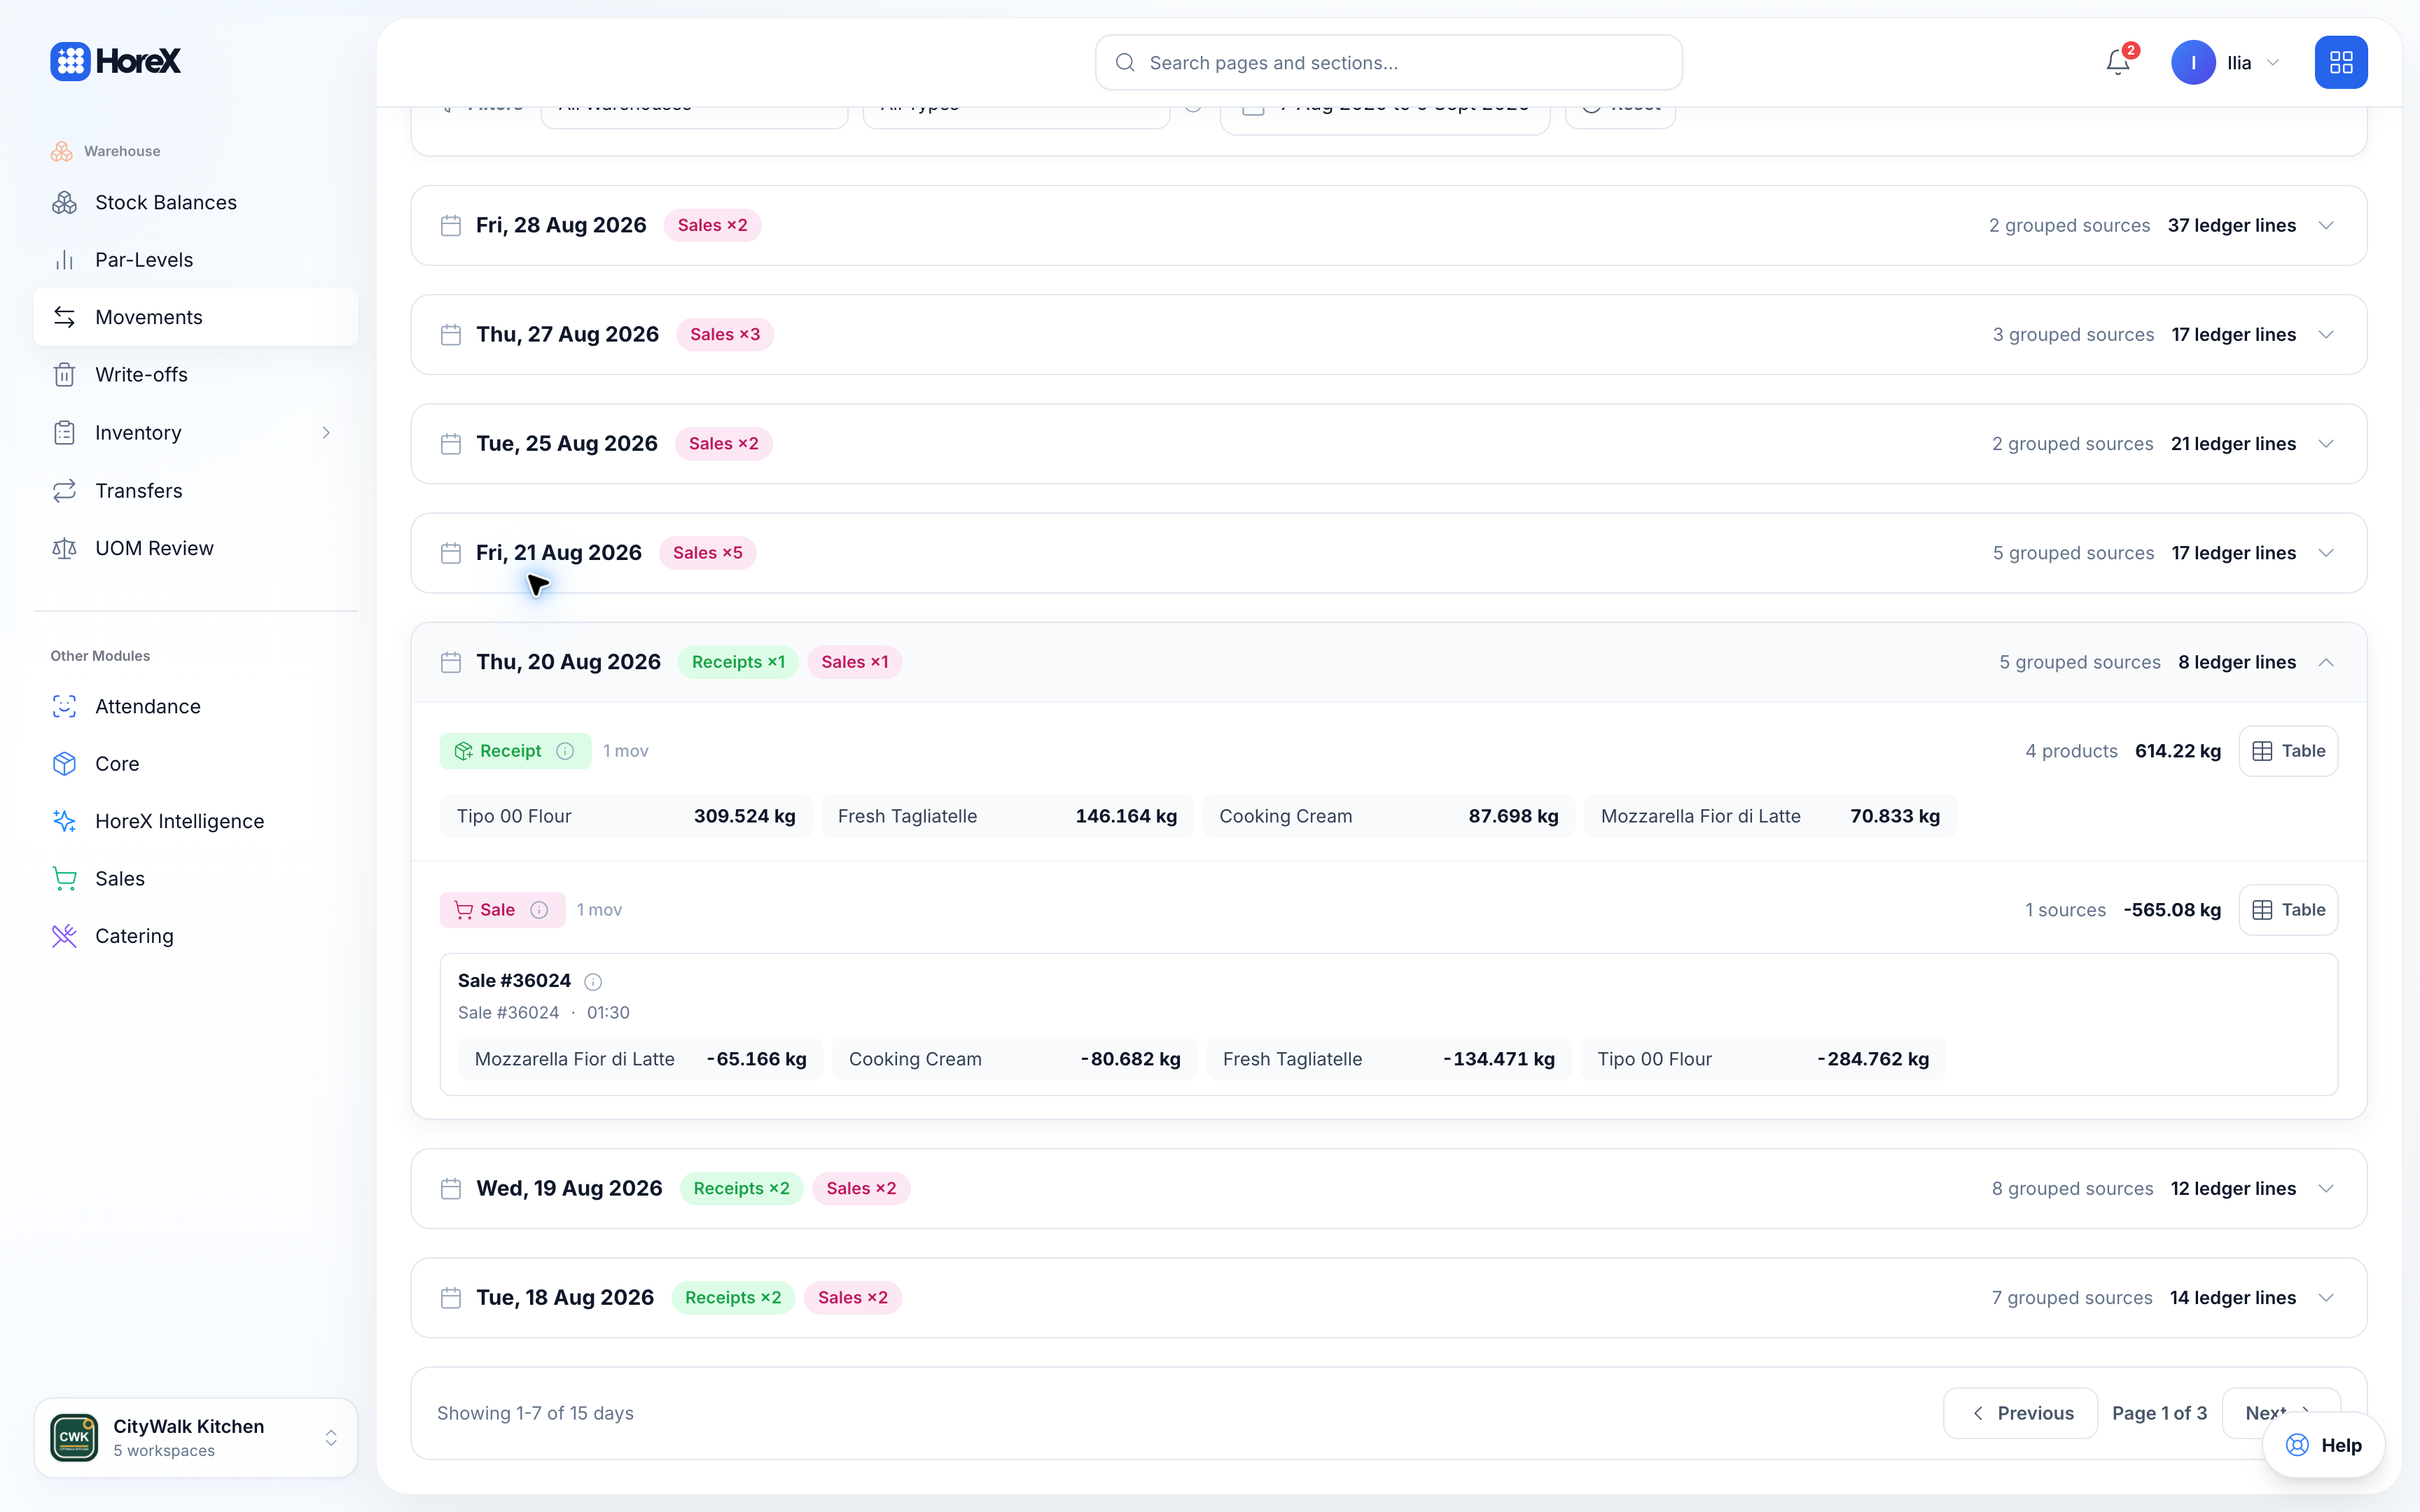
Native August stock movements with receipts and the ingredient deductions behind sale 36024
Sale 36024 and its Mozzarella ingredient deduction in the native stock movement history

Compare a physical count with the recorded balance, then inspect the product’s movement. Purchases, transfers and write-offs explain different parts of the change.

Check recipe links, units and missing costs before changing a price. Use actual-versus-theoretical analysis to compare consumption with what your production and sales would require.

  • Inventory count variance
  • Posted stock movements
  • Write-off reasons
  • Recipe and product data
  • Price effect and quantity effect
  • Supplier and invoice comparison

Explore the full reporting toolkit.

Custom analysis and specialist reports for managers, chefs, finance, HR and marketing teams.

Shift reports

Review sales, payment methods and cashier totals.

See details

Open the shift behind the day’s figures. Compare recorded cash and other payment totals, then review a difference against the orders and the physical handover. Closing a shift is a staff action; the report provides the figures for that review.

  • Shift dates and operators
  • Payment breakdown
  • Cash handover review
  • Underlying orders

Item performance

See which dishes sell and what they contribute.

See details

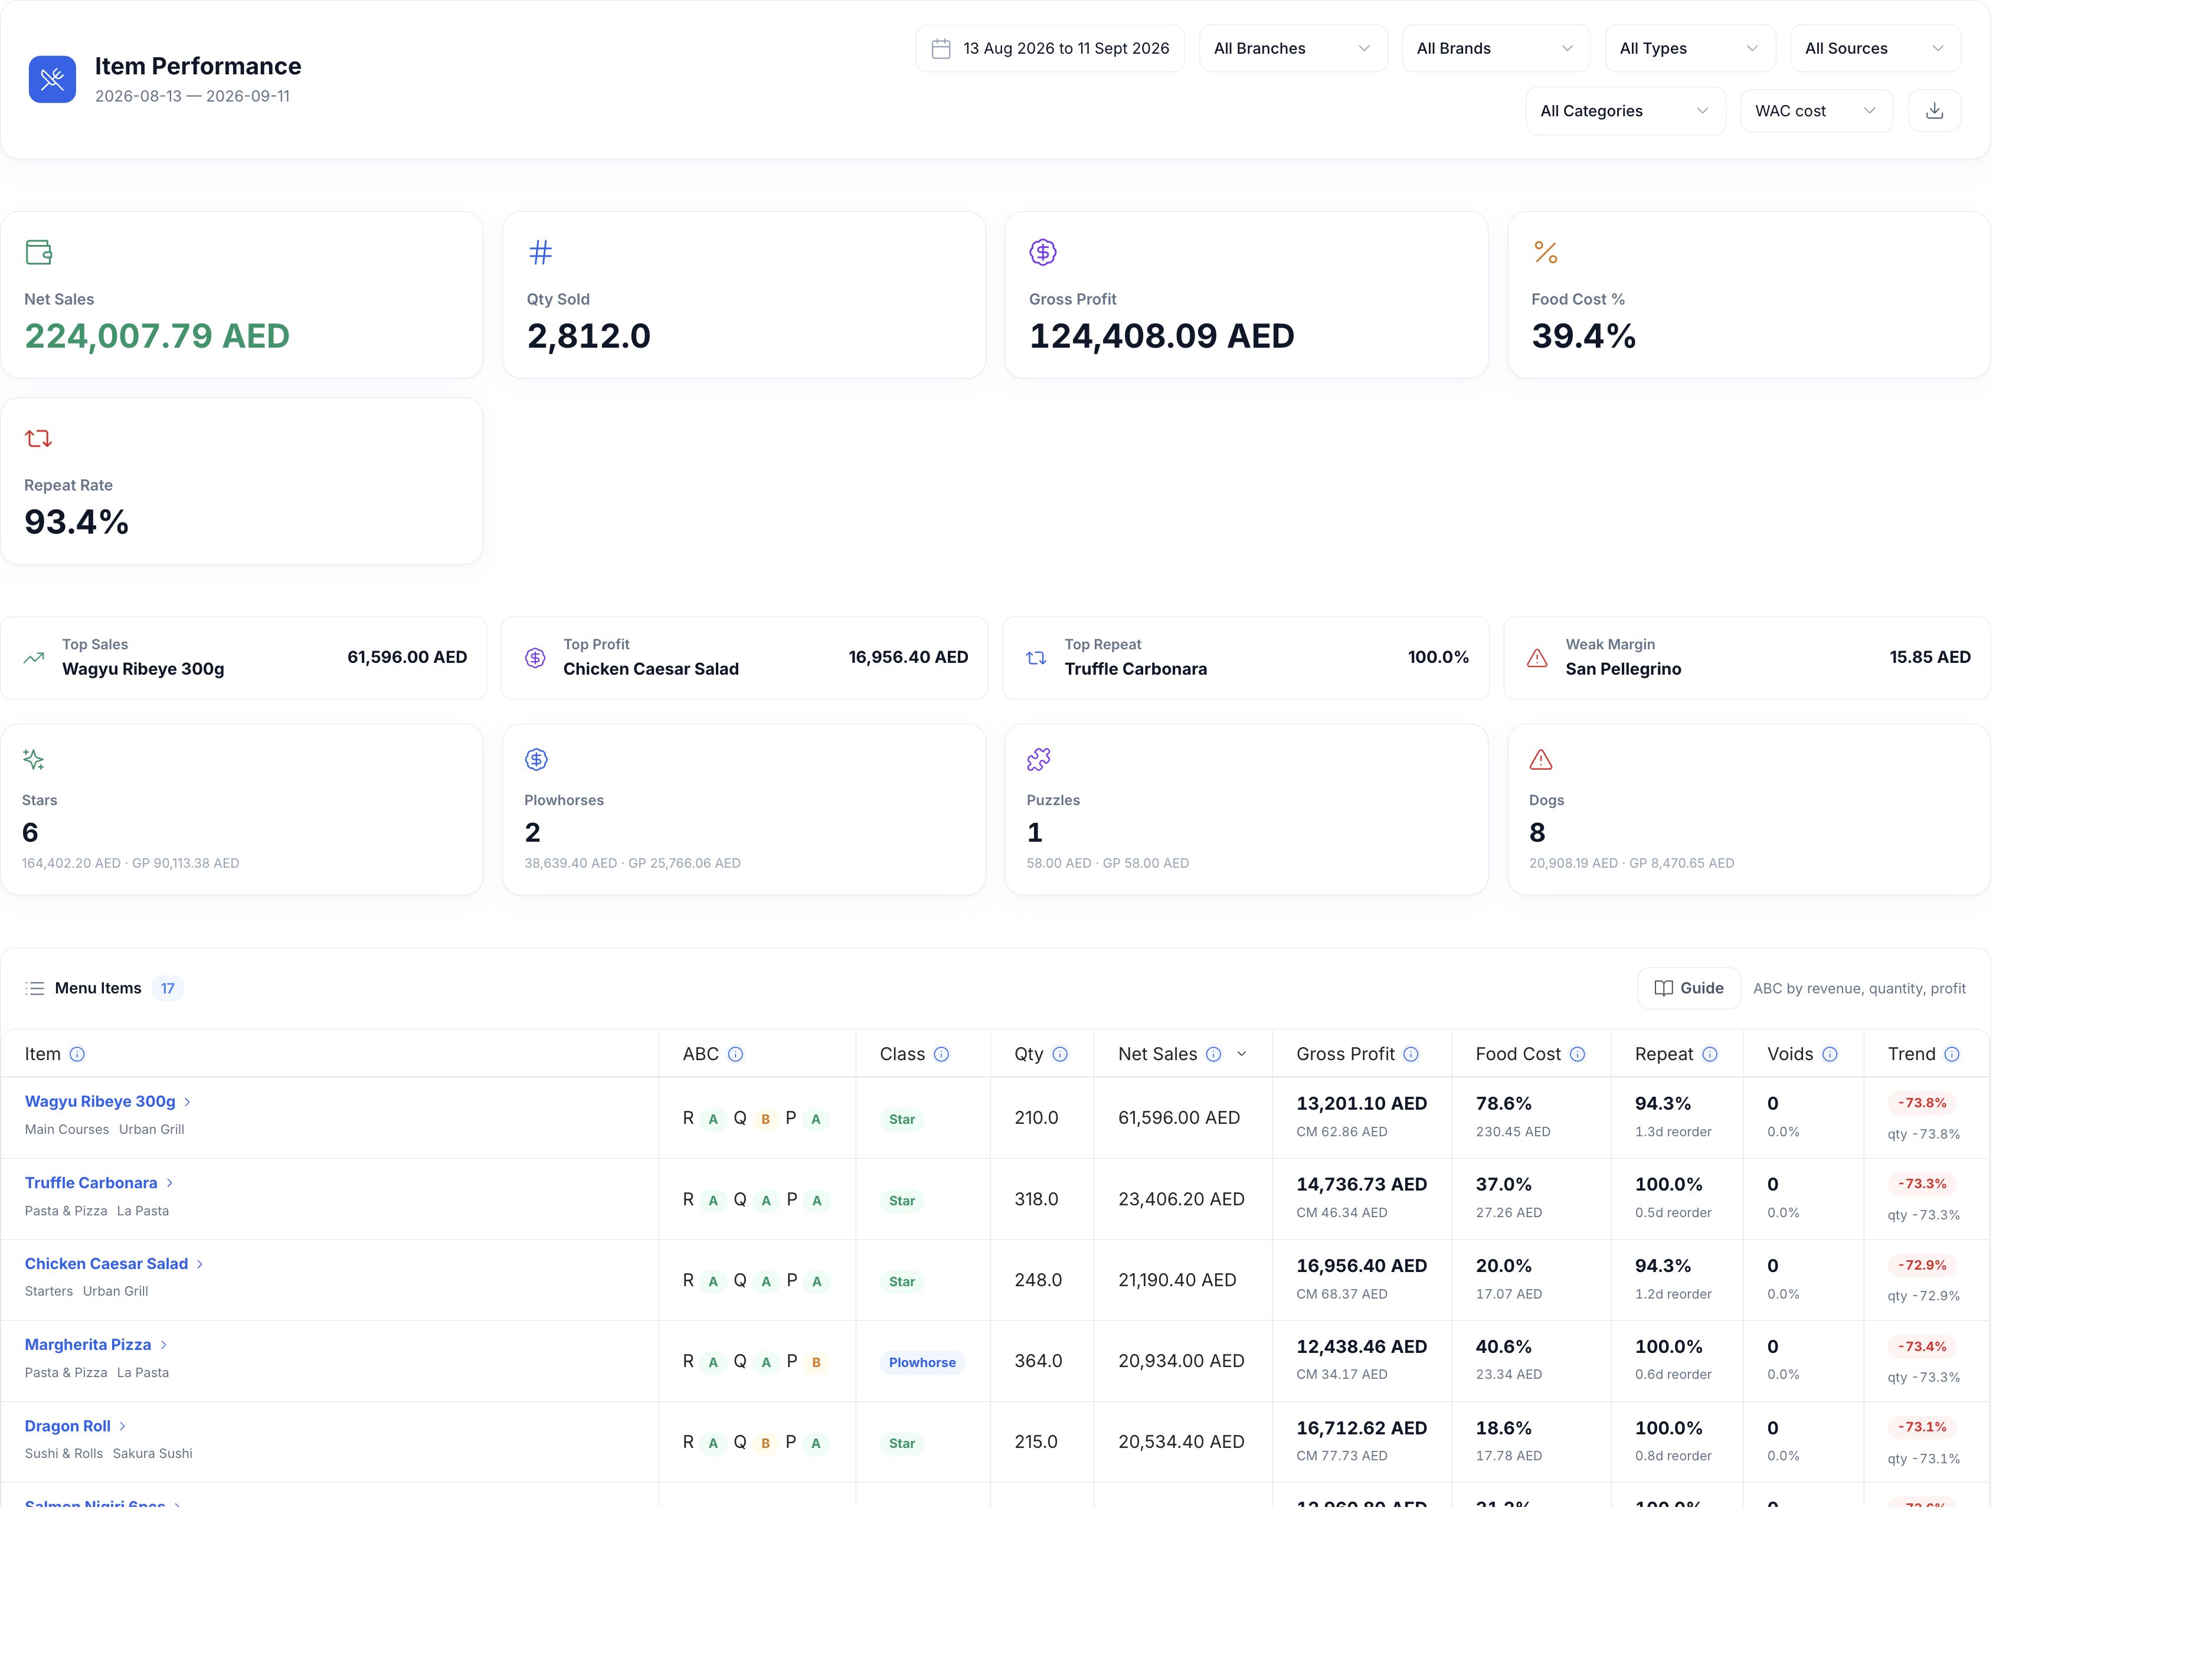
Compare quantity, net sales, recipe cost and gross profit for each dish. ABC bands and menu-engineering classes help distinguish popular items from those with a stronger contribution. Food cost uses the selected WAC or latest recipe-cost basis.

  • Sales and quantity
  • Recipe gross profit
  • ABC and menu classes
  • WAC or latest cost

Analytics Builder

Arrange a report around your question.

See details

Choose a data source, put fields in Rows and Columns, and select the measures you need. Filter the result, compare a prior period and open a result to inspect its records. Save useful configurations by name for later use.

  • Rows, columns and measures
  • Filters and custom groups
  • Period comparison
  • Saved reports

Delivery analytics

Review delivery demand and service times.

See details

Compare delivery activity by branch, source and period. Use order and service-time records to investigate delays or changes in demand. Order revenue alone is not a delivery zone’s profit; include the relevant delivery and operating costs in a profitability review.

  • Order sources
  • Branch comparison
  • Service-time analysis
  • Order context

Courier analytics

Review deliveries and the routes behind them.

See details

Follow courier workload, completed deliveries, time bands and recorded distances. A route distance may use mapping data or a clearly identified estimate. Missing location data should be checked before comparing riders or routes.

  • Courier workload
  • Completed deliveries
  • Time and distance bands
  • Data availability

Stock reports

Follow quantities from documents to balances.

See details

Inspect stock movement, purchases, transfers and write-offs for a product or branch. Open the source document when a balance needs explaining. A draft is work in progress; stock changes come from posted documents.

  • Movement history
  • Product and branch filters
  • Source documents
  • Posted stock effects

Product data checks

Find missing information behind weak reports.

See details

Check products, recipe links and purchase data when a cost is missing or a result looks unusual. A report is only as useful as its source records: resolve unmapped items, incomplete recipes and inconsistent units before making a pricing decision.

  • Product and recipe links
  • Missing cost review
  • Units and quantities
  • Source-record checks

Food cost analysis

Compare dish costs with what was sold.

See details

Item Performance shows recipe cost against net sales for the selected dishes. Inventory actual-versus-theoretical analysis answers a different question: how recorded consumption compares with the ingredients expected from production and sales. Keep the period and cost basis consistent.

  • Recipe cost basis
  • Net sales after discounts
  • Actual versus theoretical
  • Comparable periods

Revenue and P&L

Read sales alongside the costs in your accounts.

See details

Use P&L and Analytics Builder to review recognised revenue and recorded operating costs. Late invoices or unfinished records can change an open period. Branch and source filters may cover different kinds of costs; review the selected scope before comparing totals.

  • Recorded revenue
  • Operating costs
  • Branch and period scope
  • Source drill-down

Sales mix

See what your guests are ordering.

See details

Compare dishes, categories, brands and order sources by revenue and quantity. Check both popularity and contribution before changing the menu. A high-selling item can still have a high recipe cost.

  • Dishes and categories
  • Brand and source filters
  • Quantity and revenue
  • Contribution comparison

Payment changes

Inspect changes to a guest check’s payment.

See details

Review the recorded payment changes and their order references. Combine this with shift totals when investigating a discrepancy between the service record and a handover. A change is a reason to inspect the context, not evidence of wrongdoing on its own.

  • Payment history
  • Order references
  • Operator context
  • Shift reconciliation

Discounts and complimentary orders

Check what was given away and why.

See details

Discount and comp reports keep the affected order, amount and recorded reason available for review. Complimentary items consume stock even when their value is excluded from recognised sales. Treat loyalty points, promo codes and discretionary discounts according to their own records.

  • Discount amounts
  • Comp reasons
  • Loyalty and promo context
  • Stock cost of comps

Write-off analysis

Find recurring losses by product and reason.

See details

Group write-offs by product, category, branch and period. Return to the document to understand the quantity and reason. This supports a discussion about ordering, storage or preparation without assuming every difference has the same cause.

  • Product and category
  • Write-off reasons
  • Branch and period
  • Document details

Service audit reports

Investigate a specific service question.

See details

Use voided items, pre-checks, tips and order time tracking to review what happened around an order. The available operator, time and reason records help a manager follow up with the team. Access follows the employee’s permissions.

  • Voids and pre-checks
  • Tips and time tracking
  • Recorded operator and reason
  • Permission-based access

Stock variance

Compare the count with the recorded balance.

See details

A physical inventory count can differ from the expected balance. Compare quantities, movement and posted documents before deciding on an adjustment. Look for missing receipts, unrecorded waste, unit errors and counting mistakes as well as consumption differences.

  • Count versus balance
  • Quantity and value
  • Movement review
  • Adjustment context

Export and compare

Keep the report’s scope with the figures.

See details

Export the available report data in CSV, or use a report’s PDF action where provided. Analytics Builder also supports comparison with a previous period or the same period last year. Use matching filters and definitions when comparing branches or sharing figures.

  • CSV export
  • Report-specific PDF
  • Previous-period comparison
  • Matching filters

Ready-made report templates

Start with a report for a specific restaurant role.

See details

Choose from management scorecards, labor productivity, actual-versus-theoretical stock, attendance, financial results, acquisition and guest retention. A template provides a starting configuration that you can adapt.

  • Management and finance
  • Kitchen and inventory
  • People and labor
  • Guests and marketing

Saved reports & Command Center

Keep useful settings and return to them.

See details

Save a report with a name and description. Its source, dimensions, measures, filters, custom groups, comparison and view settings are retained. Update it, use Save as for a variation, or pin it to Command Center for regular review.

  • My reports
  • Save changes and Save as
  • Retained filters and view settings
  • Pin to Command Center

Custom groups and filters

Match the analysis to your business structure.

See details

Choose the source fields you need in Rows and Columns, apply filters and define value groups. Group the relevant categories or values together so recurring comparisons follow the way your team reviews the restaurant.

  • Source-specific fields
  • Row and column dimensions
  • Custom value groups
  • Report and result filters

Charts and comparison modes

Choose a useful view of the same data.

See details

Use table, column, line or heatmap views. Compare the previous period or the same period last year, show a percentage of the total, row or column, or use cumulative values. Highlight drops or outliers and set the number of leading results.

  • Four visualization modes
  • Period and year-on-year comparison
  • Shares and cumulative values
  • Highlights and result limits

Report drafts with Intelligence

Turn a question into a report you can adjust.

See details

With HoreX Intelligence enabled, describe the question in plain language. The assistant builds an unsaved report from accessible data. Review its configuration, adjust the fields and save it when it answers the intended question.

  • Natural-language question
  • Unsaved report draft
  • Editable source and layout
  • Permission-aware data access

Purchase price and quantity effects

Understand the drivers behind supplier spend.

See details

Compare purchasing with a previous period or an average of previous months. Review estimated unit-price and quantity effects by supplier, category and product, and open the linked invoice to check the underlying purchase.

  • Price and quantity effects
  • Supplier and category drivers
  • Product-level comparison
  • Linked purchase invoices

Labor and management reporting

Read staffing alongside restaurant activity.

See details

Use labor, payroll and management sources to review attendance, overtime, labor cost and productivity. Ready-made configurations help HR and operations teams begin with relevant metrics, then add the branches, periods and filters they need.

  • Attendance and labor cost
  • Overtime by employee
  • Labor productivity
  • Management scorecards

Guest and marketing reporting

Connect customer activity with business results.

See details

Use customer and marketing sources for guest retention, lifetime value, paid acquisition, reservations and feedback. Start with the corresponding ready-made report and adapt its period, groups and measures.

  • Retention and lifetime value
  • Paid acquisition performance
  • Reservations and no-shows
  • Feedback quality

Questions about Reports

Can I create a report beyond the standard templates?

Yes. Analytics Builder lets you select a data source, row and column dimensions, multiple measures, filters and custom value groups. Save the configuration once it matches your question.

What does a saved report remember?

A saved report retains its source, period, dimensions, measures, filters, custom groups, comparison, visualization and formatting settings. Reopen it and choose a new period, save changes or create a separate version with Save as.

Are there templates for different restaurant teams?

Yes. Ready-made reports cover management, sales, kitchen, purchasing, inventory, HR, finance, marketing and guest experience. You can adjust the template and save your own version.

Can I turn a table into a chart?

Analytics Builder supports table, column, line and heatmap views. It also offers period comparisons, percentages, cumulative values and highlighting, so the same data can answer different review questions.

Where should I start when food cost looks high?

Start with the period and cost basis. Item Performance compares recipe cost with net sales, while inventory analysis compares actual consumption with expected ingredients. Review missing recipe links, purchase prices, yield, units and write-offs before attributing a high percentage to one cause.

How can I investigate unusual discounts or payment changes?

Use discount, comp, void, payment-change and pre-check records to inspect the affected orders, times and recorded reasons. Compare these with the shift and ask the team about the context. A report highlights a question to investigate; it does not establish misconduct.

Can I review delivery-zone profitability?

Delivery and courier reports show demand, revenue, service times and available route information. Profitability also needs the associated courier, commission and operating costs. Order revenue or delivery distance alone should not be treated as zone profit.

Can I review results before month-end?

P&L and operational reports use the records currently available in HoreX. You can review an open period before month-end, but late invoices, unposted documents and later corrections can change it. Use the same period and accounting scope for a comparison.

How can reports help reduce food waste?

Review write-offs by product, branch and reason, then compare them with buying, stock movement and preparation. This helps identify recurring issues such as spoilage or overproduction. Investigate the source documents before deciding what to change.

How can I compare branches?

Choose the same period, filters and measures for the branches you want to compare. Analytics Builder can group results by branch or brand. Keep differences in operating costs, product setup and incomplete source records in mind.

What is Analytics Builder?

Analytics Builder lets you choose a data source, rows, columns, measures and filters. Compare periods, open result records and save a report configuration. It is useful for questions that do not fit a single fixed report.

How do I investigate an inventory-count difference?

Compare the physical count with the expected balance and trace the difference through posted movements. Check units, receiving records, transfers and write-offs. A mismatch can come from a counting or recording issue, so review it before posting an adjustment.

Can I export reports?

CSV is available in Analytics Builder and supported reports. PDF is available where the individual report provides a PDF action. Export access follows the employee’s permissions; the selected filters define the data.

How is food cost calculated?

In Item Performance, food cost is the recipe cost of the sold items divided by their net sales. The selected weighted-average or latest cost basis affects the result. Inventory consumption and P&L views can use a different scope, so compare their definitions before comparing percentages.

Bring a question from your restaurant.

We’ll show you which report answers it and how to check the figures behind it.